Remove 2007 Remove Conference Remove Forecasting Remove Procurement Analytics
article thumbnail

Supply Chain Performance Declined In the Last Decade. The Question is Why?

Supply Chain Shaman

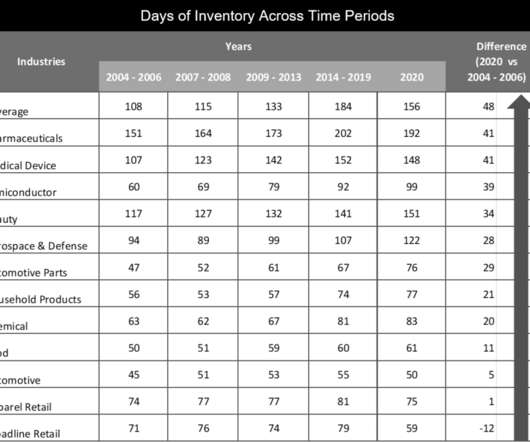
Yes, companies held more inventory (measured in days of inventory) in 2019 than at the start of the 2007 recession. Commercial and operating teams in manufacturing organizations greater than 5B$ in annual revenue were more aligned in 2007, at the beginning of the recession, than in 2020, the start of the pandemic. Alignment Barriers.


article thumbnail

How We Stubbed Our Toe in The Evolution of S&OP

Supply Chain Shaman

I wrote my first report on Sales and Operations Planning (S&OP) while sitting on the floor in the Atlanta airport in 2005 when I was an AMR Research analyst. When my flight canceled, I was en route to the annual AMR conference in Phoenix. The model in Figure 1 became the foundational model for the Gartner S&OP model.

S&OP 195
Insiders

Sign Up for our Newsletter

This site is protected by reCAPTCHA and the Google Privacy Policy and Terms of Service apply.

article thumbnail

Lifting The Gray Curtain

Supply Chain Shaman

One of the goals of the conference was to challenge the audience to redefine work. At the end of the presentation, I asked Allyson her perspective on open source analytics. My question was, ” Would the world of Python, R, and NoSQL offer for an improved modeling environment with a digital twin deployment. ” My take?

article thumbnail

2020 Requires Big Wings and Feet

Supply Chain Shaman

Next year’s conference will be on September 8th-11th in Franklin, TN, south of Nashville, TN. The design of the conference includes tours of several modern warehouses and centers of excellence. The budget is not sufficient and is often a detrimental input for supply chain forecasting. Time horizon. Bias and error.

article thumbnail

Will the Downturn Signal an Upturn?

Supply Chain Shaman

As the markets plummet, it is time to remind ourselves that demand is not a forecast. Traditional forecasting approaches are not adequate in a time of market volatility. In the real world, companies operate with a Mean Absolute Forecast Error of 24-60%, and have a bias of 9-40%. I remember December 2007 like yesterday.

article thumbnail

Building Outside-In Processes

Supply Chain Shaman

When you think about the product lifecycle from cradle-to-cradle through the moments of truth of purchase, usage, and disposal, what are the opportunities to improve corporate social responsibility? 2) Market-Driven Forecasting. So, what are the market signals to model to forecast demand at the cadence of the market?

article thumbnail

Top 2016 Supply Chain Strategy Posts from the Supply Chain Link Blog

Arkieva

Three Steps to a Better Statistical Forecast Setup. Arkieva COO – Sujit Singh, outlines three essential steps to better statistical forecasting — simulate, measure, refine. She shared that her business had implemented a statistical forecasting package from one of the leading vendors during the previous year.