Remove 2013 Remove Government Remove Inventory Remove Metrics
article thumbnail

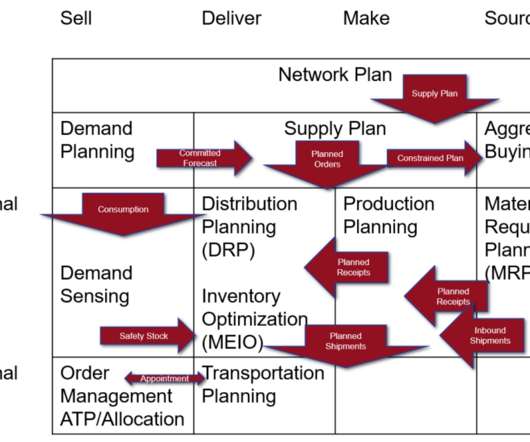
How We Stubbed Our Toe in The Evolution of S&OP

Supply Chain Shaman

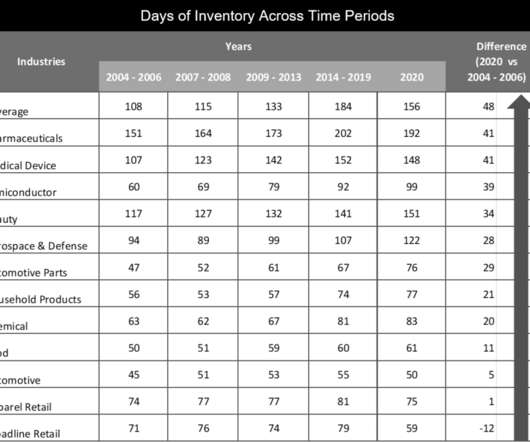
Companies tightly coupling the budget to S&OP have significantly higher inventories and lower growth than their peer group. Deployment of deeper statistical engines for inventory management with a focus on safety stock will improve inventory levels. Industries carried on average 32 days more inventory in 2020 than in 2007.

S&OP 195
article thumbnail

Q&A on the Supply Chains to Admire

Supply Chain Shaman

The NAICS designation was developed by the US Federal Government to characterize groups of companies within an industry. The companies were selected based on performance better than peer group for 2006-2013 and delivering better than average improvement within the peer group as determined by the Supply Chain Index.

Insiders

Sign Up for our Newsletter

This site is protected by reCAPTCHA and the Google Privacy Policy and Terms of Service apply.

article thumbnail

2013 Third-Party Logistics Study

Supply Chain Movement

The success of the third-party logistics industry is evident in the generally high marks given to 3PLs by respondents to a survey as part of the 2013 17th Annual Third Party Logistics Study, which identifies trends and explores how both 3PLs and shippers are using these relationships to improve and enhance their businesses and supply chains.

article thumbnail

New Bookends: The Tale of Supply Chain Global Leaders in Consumer Products

Supply Chain Shaman

Overall Results on the Supply Chain Metrics That Matter. These giants drove slight improvements in operating margin, inventory turns and Return on Invested Capital (ROIC) despite a slowing economy. Few companies have the competence in global/regional governance and business decision making capabilities of the Colgate team.

article thumbnail

Civil Strife in the Congo Brews Problems in the Coffee Supply Chain

RFgen

According to Sprudge.com, violence has driven down coffee production in the past, dropping from 130,000 to 8,000 metric tons in between the 1980s and 2013, when civil conflict was at its peak. These suppliers still face government corruption and security concerns. This throws off inventory and ultimately impacts the consumer.

Congo 52
article thumbnail

Why we need S&OP Vision, Culture, and Language

Supply Chain Trend

For Our Company, S&OP Is Operations (O) and Inventory without Involving Sales (S)! When It Comes to Metrics for S&OP, “One Size Fits All.”. Their orientation is on supply chain, but there are needs for S&OP as a business-governing model in other areas. Give and Take , Weidenfeld & Nicolson, April 2013.

S&OP 60