Remove 2007 Remove Forecasting Remove Metrics Remove Report
article thumbnail

Supply Chain Performance Declined In the Last Decade. The Question is Why?

Supply Chain Shaman

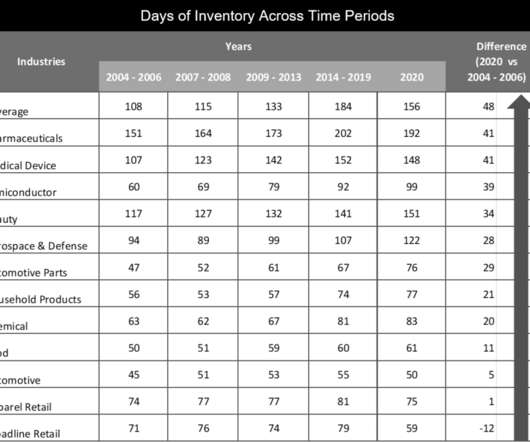
Yes, companies held more inventory (measured in days of inventory) in 2019 than at the start of the 2007 recession. Commercial and operating teams in manufacturing organizations greater than 5B$ in annual revenue were more aligned in 2007, at the beginning of the recession, than in 2020, the start of the pandemic. Alignment Barriers.

article thumbnail

How We Stubbed Our Toe in The Evolution of S&OP

Supply Chain Shaman

I wrote my first report on Sales and Operations Planning (S&OP) while sitting on the floor in the Atlanta airport in 2005 when I was an AMR Research analyst. I wrote many reports on airport floors in those days–electrical plugs were just too scarce.) Now I was naive when I wrote the reports at AMR. Measure it.

S&OP 195
Insiders

Sign Up for our Newsletter

This site is protected by reCAPTCHA and the Google Privacy Policy and Terms of Service apply.

article thumbnail

What is Supply Chain Visibility and Why Isn’t It Enough?

Logistics Viewpoints

According to the Global Supply Chain Disruption and Future Strategies Survey Report, this goal was the top-ranked planned tool investment. Agility relies on having this kind transparency at your fingertips, through concurrent planning, so you aren’t waiting on analysis and a report from a link up or down the chain.

article thumbnail

2020 Requires Big Wings and Feet

Supply Chain Shaman

The budget is not sufficient and is often a detrimental input for supply chain forecasting. Why Is the Financial Forecast Not a Good Proxy for a Supply Chain Forecast? There are many reasons why the budget cannot be used as a supply chain forecast. The budget is for a fiscal year with quarter reporting and updates.

article thumbnail

Will the Downturn Signal an Upturn?

Supply Chain Shaman

As the markets plummet, it is time to remind ourselves that demand is not a forecast. Traditional forecasting approaches are not adequate in a time of market volatility. In the real world, companies operate with a Mean Absolute Forecast Error of 24-60%, and have a bias of 9-40%. I remember December 2007 like yesterday.

article thumbnail

Is A Customer-Centric Strategy the Same as Demand-Driven? Outside-In?

Supply Chain Shaman

A Demand-Driven Value Network as defined by AMR Research in 2007: A network that senses demand with minimal latency to drive a near real-time response to shape and translate demand. It is about much, much more than Vendor Managed Inventory (VMI ) or Collaborative Forecasting and Replenishment. Market-Driven Processes. Demand Sensing.

article thumbnail

Nine Myths of S&OP Technology Selection

Supply Chain Shaman

Each year, I publish a report analyzing the technologies in the S&OP space. Finishing this report was my focus this week. It took me six months to do the research and sixty hours to write the report. Needless to say, completing the report was a lot of work. It is a well-read report. It is just too easy.

S&OP 150