Remove Chemicals Remove Comparison Remove Inventory Remove Sourcing
article thumbnail

Supply Chain Diagnostic: A Four-Step Process

Supply Chain Shaman

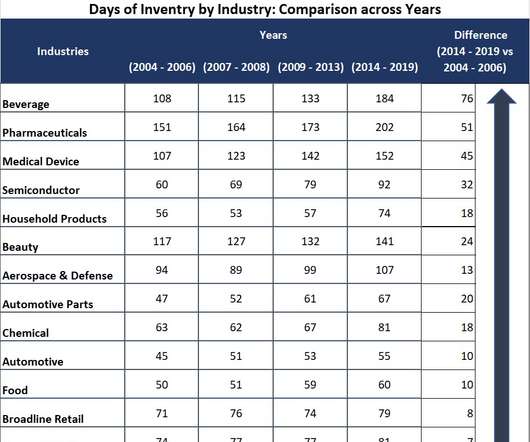
” Or alternatively, “Is there data that could be sourced to help?” In Figure 1, we show the aggregate trend of the chemical industry in an orbit chart format showing year-over-year results at the intersection of two metrics operating margin and inventory turns. inventory turns. inventory turns.

article thumbnail

Holding Ourselves Accountable for Business Results

Supply Chain Shaman

Orbit Chart of Four Industry Sectors at the Intersection of Operating Margin and Inventory Turns (Year-over-Year Averages for the Sector). Lack of Focus on Form & Function of Inventory and Designing Network Flows. As supply chains moved from regional to global, intransit and cycle inventories increased. Maturity Model.

Insiders

Sign Up for our Newsletter

This site is protected by reCAPTCHA and the Google Privacy Policy and Terms of Service apply.

article thumbnail

Elevating The Voice of the Supply Chain Contrarian

Supply Chain Shaman

Table 2: Gartner Top 25 Comparison to Peer Group Results As large manufacturers work the conference circuit in the industry to increase brand awareness for their supply chain efforts, they feed the perception that their stories demonstrate supply chain leadership. Is this success? I don’t think so.

Gartner 374
article thumbnail

Announcing the Supply Chains to Admire for 2019

Supply Chain Shaman

The source data for the analysis comes from Ycharts.). It is not as simple as trading-off inventory, cost, and customer service. Comparison To The Gartner Top 25. Shown in Figure 3 is the comparison of the two approaches. Comparison of the Supply Chains to Admire and the Gartner Top 25 Methodologies. .

article thumbnail

Parts Are Not Parts

Supply Chain Shaman

A slight change within a function–in sourcing or manufacturing, or along the chain–can greatly impact the outcomes of cost, customer service, or working capital. Today, over 90% of companies have deployed ERP and APS, but as shown in Table 1, inventory levels have grown not decreased in over 80% of industries studied.

article thumbnail

Will the Downturn Signal an Upturn?

Supply Chain Shaman

Vendor Managed Inventory processes–once hailed as the panacea of demand sensing–largely operate in isolation within sales organizations (of the thirty-three organizations that we interviewed last year, no market leader has connected these demand signals). ” They questioned, “ How long will this recession last?

article thumbnail

When We Don’t Have Answers, We Need to Work Quickly To Build Them

Supply Chain Shaman

Let’s Start With a Discussion on Inventory. When we look at table 1, we see burgeoning inventories in some industries and extreme shortages in others. We are not good at inventory management. Inventory Levels Over the Quarters of the Pandemic. Companies struggle to have the right inventories. The end result?