Remove Chemicals Remove Inventory Remove Metrics Remove Sourcing
article thumbnail

Holding Ourselves Accountable for Business Results

Supply Chain Shaman

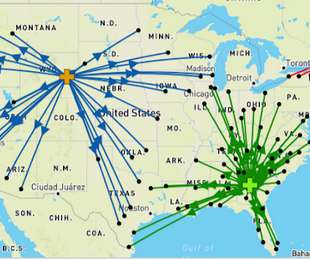
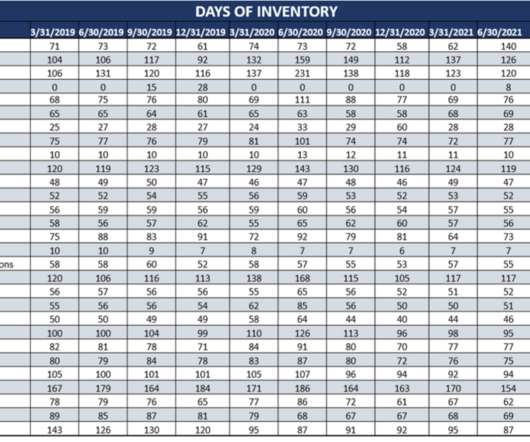
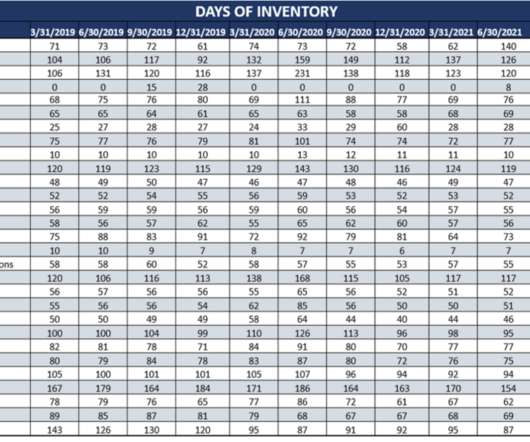
Orbit Chart of Four Industry Sectors at the Intersection of Operating Margin and Inventory Turns (Year-over-Year Averages for the Sector). Lack of Focus on Form & Function of Inventory and Designing Network Flows. As supply chains moved from regional to global, intransit and cycle inventories increased. Maturity Model.

article thumbnail

5 Recommendations towards a Resilient S&OP

Logistics Viewpoints

As product flows rapidly shifted and hard baked assumptions about lead times and sourcing locations were put to test, users across many organizations bypassed their planning systems and turned to excel sheets, internal data science teams or non-traditional supply chain vendors who could deliver AI based solutions at a faster turn.

S&OP 244
Insiders

Sign Up for our Newsletter

This site is protected by reCAPTCHA and the Google Privacy Policy and Terms of Service apply.

article thumbnail

The Power of the Network: ERP vs. Spend Management

Logistics Viewpoints

Of the professionals surveyed, 59% saw the gap between procurement/sourcing and supply chain to be a major disconnect, and the most pressing pain point. Both procurement solutions from ERP companies like Oracle or Infor – or business spend management solutions – can help companies enforce these sourcing supplier decisions.

article thumbnail

Measuring Up?

Supply Chain Shaman

The supply chain is a complex system with finite, and non-linear relationships between supply chain metrics that drive balance sheet results. In our analysis, only one out of ten companies successfully improves operating margins and inventory turns at the same time. We find that companies can improve one, but not two of the metrics.

article thumbnail

Supplier Quality Management: What it is, 5 Key Metrics to Know & a 4 Step Supplier Evaluation Process

GlobalTranz

The next posts in the series will break down metrics and issues to consider in SQM by industry and conclude with a case study on the application of SQM. 5 Key Metrics to Use for Scoring Supplier Quality Management (From LNS Research ). The definition of this metric is similar to the way it sounds. Cost of quality.

article thumbnail

Supply Chain Diagnostic: A Four-Step Process

Supply Chain Shaman

” Or alternatively, “Is there data that could be sourced to help?” In Figure 1, we show the aggregate trend of the chemical industry in an orbit chart format showing year-over-year results at the intersection of two metrics operating margin and inventory turns. inventory turns. inventory turns.

article thumbnail

Control Towers: If Only There Was A Clear Definition

Supply Chain Shaman

While there are many types of visibility (see Figure 1), the most common use case is either sourcing or transportation visibility. The focus is on functional metrics, but are unable to get to overall supply chain metrics. In this blog post, I give a framework to drive discussions. Visibility. Gaps in Enterprise Visibility.