This site uses cookies to improve your experience. To help us insure we adhere to various privacy regulations, please select your country/region of residence. If you do not select a country, we will assume you are from the United States. Select your Cookie Settings or view our Privacy Policy and Terms of Use.
Cookie Settings
Cookies and similar technologies are used on this website for proper function of the website, for tracking performance analytics and for marketing purposes. We and some of our third-party providers may use cookie data for various purposes. Please review the cookie settings below and choose your preference.
Used for the proper function of the website
Used for monitoring website traffic and interactions
Cookie Settings
Cookies and similar technologies are used on this website for proper function of the website, for tracking performance analytics and for marketing purposes. We and some of our third-party providers may use cookie data for various purposes. Please review the cookie settings below and choose your preference.
Strictly Necessary: Used for the proper function of the website
Performance/Analytics: Used for monitoring website traffic and interactions
In today’s architectures and functional metrics, value optimization does not exist. And, when procurement and tactical planning operate in isolation, there is no decision support framework to guide the trade-offs especially when the functions are tethered to different and conflicting metrics. You are right.
During his tenure in the industry, he built innovative pricing and forecasting models, leveraging internal and external data sources to improve internal decision-making and increase profitability. Prior to joining DAT, Adamo led the pricing and decision science teams at FedEx.
Background I find that each conference provides the audience with a new framework to consider. The issue is that when companies optimize functional metrics, they throw the supply chain out of balance and sub-optimize value. Many messages to the market, but where is the value? The focus is on unveiling a new, bright, and shiny object.
The research methodology for the Supply Chains to Admire compares the performance of a company against its industry peer group for the metrics of Year-over-Year Revenue Growth, Inventory Turns, Operating Margin, and Return on Capital Employed (ROCE). For 80% of industries, the supply chain metrics represent more than 40% impact on value.
The relationship between corporate financial performance and supply chain metrics was complex; and in my first attempts, I was unable to derive a correlation. The year 2012 marked the 30th anniversary of the use of supply chain management as a cross-functional process for source, make and deliver in the commercial sector. Definitions.
I smiled on the week following the conference as the accolades piled up in my inbox. Attending the conference was Alexia Howard, Senior Research Analyst – US Foods for Sanford C. Following the conference, Alexia asked for me to share the methodology with over 150 financial analysts. Aligned Metrics.
Conference Call Members of Descartes' executive management team will host a conference call to discuss the company's financial results at 5:30 p.m. Designated numbers are +1 289 514 5100 for North America and +1 800 717 1738 for international, using conference ID 26605. We wish him well in his future endeavors,” said Mr. Ryan.
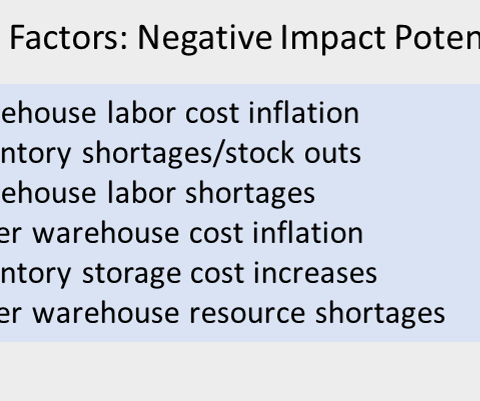
Results from The Conference Board’s C-SUITE OUTLOOK survey showed supply chain disruptions, labor shortages, and rising inflation to be 3 of the 5 high impact external factors on the minds of CEOs. However, I am surprised at the degree that localized sourcing is being considered.
Here we share the answers to the questions that we get the most often about this research: What is the source of data? We placed them in the industry that they were the most like, e.g., the primary source of revenue. Yes, we will do this study yearly in the preparation for our annual conference. What is the Supply Chain Index?
A notable exception is MercuryGate (a Talking Logistics sponsor), which was founded 17 years ago and recently held its annual user conference in Las Vegas. The theme of this year’s conference was ‘The Future of Delivery,” which I love because it raises a lot of questions and possibilities (see my recent post on the topic).
The vehicle deployments are expected to lower emissions by 7,052 metric tons of greenhouse gas (GHG) emissions annually, equivalent to 1,533 passenger cars removed from the road. The Teamsters Canada Rail Conference, which represents nearly 10,000 rail workers at the two companies, has been without contracts since the end of last year.
The source data for the analysis comes from Ycharts.). We selected these metrics based on correlation work with Arizona State University in 2012. The winners drove long-term value (measured by market capitalization) while outperforming on the portfolio of metrics shown in Figure 1 and driving improvement faster than their peer groups.
That was the key message Doug Braun, CEO of BluJay Solutions (a Talking Logistics sponsor), delivered in his keynote presentation at the SOAR 2018 Customer Conference last month. Source: BluJay Solutions. Source: Adelante SCM / BluJay Solutions Research Study. How do you define it?
The team was organized around the functional silos of source, make and deliver. Instead, we found that the companies with the lowest total supply chain cost (a total of source, make and deliver) had average costs in manufacturing and distribution. We are a month away from the publication of Supply Chain Metrics that Matter.
This week, at Supply Chain Insights LLC, we published our 11th report in the series titled Supply Chain Metrics That Matter. When companies look at singular metrics (labor costs or inventory), they have moved backwards. Aligning metrics matters. Functional metrics in isolation degrade value.
Supply chain and procurement executives should urgently pay heed to the need to make sure it is distributed to them, said Jay Koganti, vice president supply chain at the Center of Excellence of Estée Lauder , during a presentation titled “ AI Trends Transforming Supply Chain – and How Leaders Should Respond,” at the DPW New York conference June 11.
My first digital supply chain presentation was in Milan at an SAP Insider conference in 2012.) The investments in new approaches and deploying outside-in processes enables quicker sensing and bi-directional orchestration across source, make, and deliver. Traditional planning taxonomies focus on the optimization of functional metrics.
Last month, I attended and spoke at the Command Alkon ELEVATE 2017 conference , where I learned many things about the Heavy Building Materials (HBM) industry. The elevation journey actually began the day before the conference officially started. So, what are some of the data challenges the industry faces?
I was attending the Zycus Horizons 2014 conference at Amelia Island today, listening to speakers. And we follow a pattern: you do an assessment, a sourcing wave, build a process, and do it over and over. Over time, you get decent at this cycle. It is amazing that we do the same things.
The next posts in the series will break down metrics and issues to consider in SQM by industry and conclude with a case study on the application of SQM. 5 Key Metrics to Use for Scoring Supplier Quality Management (From LNS Research ). The definition of this metric is similar to the way it sounds. Cost of quality.
Here we share the answers to the questions that we get the most often about this research: What is the source of data? We placed them in the industry that they were the most like, e.g., the primary source of revenue. Yes, we will do this study yearly in the preparation for our annual conference. What is the Supply Chain Index?
This research was the backbone of the Supply Chain Metrics that Matter series of reports. Instead, they have measured functional metrics or focused on projects. I believe that customer service is a critical metric and a key element of managing a complex supply chain system. The Building of the Index. Check them out!
Howard Schultz, the CEO of Starbucks, shared that insight during his keynote address at last week’s Council of Supply Chain Management Professionals (CSCMP) Annual Conference. The post Supply Chain Talent: Insights from CSCMP Annual Conference appeared first on Talking Logistics with Adrian Gonzalez.
The selection of metrics is based on prior work with Arizona State University to understand which metrics, in combination, correlate to market capitalization and price to book value. The processes of make, source, and deliver reports to a common leader in only 40% of businesses. Why do we spend four months doing this?
I have taken myself off the road to write the book Metrics That Matter. Instead, you book the biggest conference room in the building and invite a cross-functional team to review what happened in 2013. You just do not see the patterns of the interrelationships of metrics in an Excel spreadsheet. It is a slow week.
I began analyzing correlations of groups of metrics to market capitalization and found that the most significant correlation was between market capitalization and growth. When companies were growing, I also discovered that the cost and inventory metrics better aligned with peers. In Table 1, I share a comparison of the two methods.
Next year’s conference will be on September 8th-11th in Franklin, TN, south of Nashville, TN. The design of the conference includes tours of several modern warehouses and centers of excellence. To maximize value—price to tangible book, functional metrics need to be reset to focus on reliability.
They source from approximately 15,000 suppliers with a sourcing spend of over €7 billion. But even multi-sourcing is not enough. A supply chain is mapped, where components are source from, how they flow through a supply chain to factories and out to customers. Their revenues exceed €25 billion.
Traditionally, the focus has been on building efficient organizational silos for make, source or deliver. As a result, tor most companies, the goals are unclear and the financial metrics are not well-understood. This year-over-year comparison, enables visualization of performance on two metrics. Overview of the Methodology.
I have learned that supply chain systems are more complex than I originally thought, and that the relationships between supply chain metrics are nonlinear. These tools allow us to look at sell, source, make, and deliver together. Next week I will be speaking at the Llamasoft Summercon conference (follow this link to see the slides).
In the traditional supply chain world, the processes of sell, deliver, make, source, and plan are separate and distinct. The metrics reward functional thinking. I have been speaking at conferences around the world and inviting them all to watch the Supply Chain Insights Global Summit live streaming where we will debate these concepts.
Pete Bennett, and his co-presenter, Mary Byrne, the vice president of supply and demand planning, spoke during a presentation at Kinaxis’ user conference Kinexions. The Cardinal Health Supply Chain Cardinal Health’s medical segment manufactures, sources and distributes Cardinal Health branded medical, surgical and laboratory products.
The supply chain is a complex system with finite, and non-linear relationships between supply chain metrics that drive balance sheet results. We find that companies can improve one, but not two of the metrics. Teams struggle to drive improvement in both metrics at the same time. A Look at History. Resiliency.
During the spring, I get to spend a lot of time in airplane(s) attending and speaking at technology confer ences. With the rise in complexity, most Supply Chain Metrics That Matter are going backwards (inventory turns, ROIC, operating margin and growth). Open source needs maintenance. I have done this for a decade.
Throughout the conference I met with several software and hardware providers to get a glimpse into what they were showcasing. The most interesting thing that Blue Yonder is doing from an OMS standpoint is driving promising and pre-sourcing to retailers.
We draw a timeline on a conference room wall and using customer shipment and compliance data, we plot the issues with customer service and product outages. ” Or alternatively, “Is there data that could be sourced to help?” As a group, we drill into root issues. Let’s take an example.
As a result, at conferences, I am often introduced as a consultant. The winners drive improvement while posting financial results in the Supply Chain Metrics That Matter ahead of the peer group. A Supply Chain Leader will make progress on both of these key metrics with a very tight and controlled pattern. 5) Design.
The field of supply chain management–combining source, make and deliver–into a common process started in 1982. Bandied about terms like best practices and “supply chain leaders” fill the air at supply chain conferences. Figure 1: Supply Chain Metrics Are a Balancing Act. The evolution sprung from chaos.
The source data for the analysis is public reporting of balance sheets and income statements. Check out their performance by plotting year-over-year metrics at the intersection of two ratios and look at the patterns. In the analysis of the Supply Chains to Admire, we use PTBV as a proxy metric of value.
Last week at the Gartner Supply Chain Symposium/Xpo™ 2024 conference in Barcelona, the supply chain community gathered for one of the most anticipated events of the year. Moving Towards Best of Breed, Not Platform, Solutions The conference highlighted a significant shift towards composable architecture.
Over the course of the last decade, companies have moved at different rates to align source, make and deliver processes to report to common leader. Based on our research at Supply Chain Insights , today, 34% of supply chain organizations have source, make and deliver reporting through a common organization.
Do we have the right Service Level Agreement metrics in place? At the LogiChem conference [a couple of months ago], there was a discussion about the risks logistics service providers take on when they sign up a new customer. Is the mode of transport the most efficient to impact on-time delivery? At what cost?
Source: Google. This was not a trivial transition because the software industry, until relatively recently, was long fixated on measuring its health and success by new license revenue (sales of products) instead of customer-centric metrics, such as realization of ROI and payback objectives. Where is Descartes today?
As we discussed this drawing the dialogue flowed in the conference room. The network senses, translates, and orchestrates market changes (buy- and sell-side markets) bidirectionally with near real-time data to align sell, deliver, make and sourcing organizations outside-in. .” I drew the picture shown in Figure 1.
We organize all of the trending information in your field so you don't have to. Join 102,000+ users and stay up to date on the latest articles your peers are reading.
You know about us, now we want to get to know you!
Let's personalize your content
Let's get even more personalized
We recognize your account from another site in our network, please click 'Send Email' below to continue with verifying your account and setting a password.


Let's personalize your content