Remove 2007 Remove Conference Remove Forecasting Remove Warehousing
article thumbnail

How We Stubbed Our Toe in The Evolution of S&OP

Supply Chain Shaman

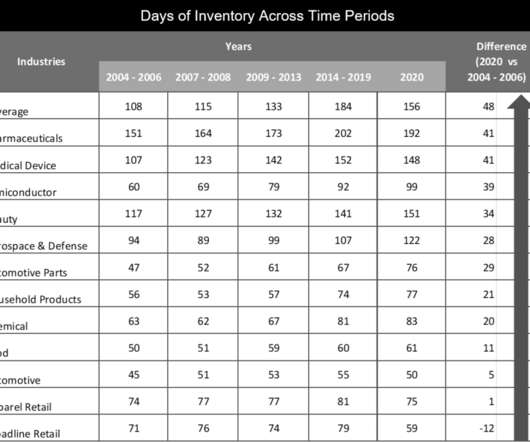
When my flight canceled, I was en route to the annual AMR conference in Phoenix. Tight coupling of the supply chain forecast to the financial forecast will improve value. Industries carried on average 32 days more inventory in 2020 than in 2007. (I Why do we have 32 days more inventory by company in 2020 than in 2007?

S&OP 195
article thumbnail

2020 Requires Big Wings and Feet

Supply Chain Shaman

Next year’s conference will be on September 8th-11th in Franklin, TN, south of Nashville, TN. The design of the conference includes tours of several modern warehouses and centers of excellence. The budget is not sufficient and is often a detrimental input for supply chain forecasting. Bias and error.

Insiders

Sign Up for our Newsletter

This site is protected by reCAPTCHA and the Google Privacy Policy and Terms of Service apply.

article thumbnail

Will the Downturn Signal an Upturn?

Supply Chain Shaman

As the markets plummet, it is time to remind ourselves that demand is not a forecast. Traditional forecasting approaches are not adequate in a time of market volatility. In the real world, companies operate with a Mean Absolute Forecast Error of 24-60%, and have a bias of 9-40%. I remember December 2007 like yesterday.

article thumbnail

Building Outside-In Processes

Supply Chain Shaman

2) Market-Driven Forecasting. Inside-out, traditional processes forecasting processes use statistical methods to predict the future based on order and shipment patterns. So, what are the market signals to model to forecast demand at the cadence of the market? How can you build market-driven forecasting processes?

article thumbnail

Spreadsheets – A Look Back

Kinaxis

From our eBook, S&OP in the 21st century , “An audit of 50 corporate spreadsheets in 2007 revealed that 94% had errors… one for $100 million!” An error in forecasting made by one function will almost always have an impact on at least one or more other functions.

article thumbnail

Top 2016 Supply Chain Strategy Posts from the Supply Chain Link Blog

Arkieva

Three Steps to a Better Statistical Forecast Setup. Arkieva COO – Sujit Singh, outlines three essential steps to better statistical forecasting — simulate, measure, refine. She shared that her business had implemented a statistical forecasting package from one of the leading vendors during the previous year.

article thumbnail

VTech: A Story of a Supply Chain Leader

Supply Chain Shaman

VTech drove significant improvement in operating margin through the recession of 2007-2009 and then drove improvement in both inventory margin and operating margin for the period of 2010-2012 with some regression in the period of 2013-2015. At that time, I attended many conferences. It took us three years to right the ship.