This site uses cookies to improve your experience. To help us insure we adhere to various privacy regulations, please select your country/region of residence. If you do not select a country, we will assume you are from the United States. Select your Cookie Settings or view our Privacy Policy and Terms of Use.
Cookie Settings
Cookies and similar technologies are used on this website for proper function of the website, for tracking performance analytics and for marketing purposes. We and some of our third-party providers may use cookie data for various purposes. Please review the cookie settings below and choose your preference.
Used for the proper function of the website
Used for monitoring website traffic and interactions
Cookie Settings
Cookies and similar technologies are used on this website for proper function of the website, for tracking performance analytics and for marketing purposes. We and some of our third-party providers may use cookie data for various purposes. Please review the cookie settings below and choose your preference.
Strictly Necessary: Used for the proper function of the website
Performance/Analytics: Used for monitoring website traffic and interactions
If your systems are disjointed and you lack the ability to analyze masses of data in real time, you will struggle to deliver on-time, in-full and your reputation and revenue will be negatively impacted. This blog is Part 1 in our Optimizing Supply Chain Performance with Unified Data series, with a focus on optimizing fulfillment.
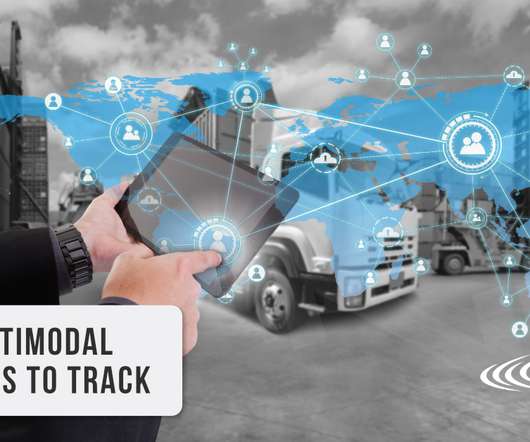
Creating a data-driven supply chain tracking important transportation metrics helps shippers respond and adapt as quickly as possible to known and unknown events. Why Monitor Transportation Metrics. Actionable data is one of the most critical business drivers.
Complexity and precision data within the transportation and shipping industry require refinement in measuring and recording metrics. That is where multimodal metrics that leverage transportation data can make all the difference.
As Josh and his partner scaled Launch Fulfillment , they encountered some cash flow issues inherent in high volume parcel shipping that their ecommerce customers required. Client Access & Transparency: Provides client access to their shippingdata for increased transparency and decreased administrative overhead.
billion rate data points monthly to provide the most comprehensive view of the market, helping you identify savings opportunities and make data-driven decisions. Our platform can be deployed alongside your current solutions, providing immediate value without disrupting established workflows.
Supply chain orchestration is about managing the movement of goods, data, and decisions across the entire supply networkstarting with suppliers and continuing through to the customer. Why Orchestration Matters The more connected a supply chain becomes, the more it depends on timely, accurate data and consistent communication across teams.
With freight transport accounting for a significant share of global emissions, efforts to improve logistics now extend beyond operational metrics to include resilience, regulatory compliance, and climate performance. This shift reflects a broader transition toward data-driven, performance-based management of freight networks.
This year, a recurring theme that I saw was about using supply chain data to improve the customer experience across the entire value chain. Here are the ones that stood out to me, especially as it relates to supply chain data. The single data cloud runs on Snowflake, one of Blue Yonder’s partners.
VMI has great promise in the use of channel data and the management of flow. The problem was that VMI is a ship through model whereas supply chain planning is a ship from model with different granularity. The other issue is that VMI only represents a small percentage of the channel.
Three months into 2025, we have seen a barrage of on-again, off-again tariffs that have supply chain and logistics teams reeling, as they must rethink everything from next weeks shipping route to their foundational network models. The Ukraine-Russia conflict is ongoing. With the global e-commerce market predicted to reach $8.1
While we live in an age where same-day delivery and free shipping have become customer expectations, we also live in an age where dimensional weighting and quarterly accessorial increases have become a reality from the carrier. Below are my four keys to effectively using real-time data and realizing the benefits of proactive analytics.
The systems–based on shipment and order data–were out of step with the market. With fixed models and hard-wired data feeds, teams could not adjust the planning systems to use consumption data or market indicators. Next Steps: Start to model demand based on market data to align the organization on baseline demand.
billion rate data points monthly to provide the most comprehensive view of the market, helping you identify savings opportunities and make data-driven decisions. Our platform can be deployed alongside your current solutions, providing immediate value without disrupting established workflows.
How shippers can overcome rising rates by getting access to better data all while increasing customer loyalty and retain customers. Listen to “How Shippers Can Compete Against Rising Transportation Costs & Competition Using Data” on Spreaker. 8 Big Factors to Consider for Efficient LTL Shipping. Download eBook.
My goal is to convince you to ground supply chain processes and technology implementations in data analysis while tying the results to the improvement in corporate performance. Let me make my point by sharing some financial data using client examples from the last decade. So, I asked the questions, “Is your data forecastable?
We’ll examine the key components of efficient supply chains, explore essential performance metrics, and uncover the fundamental drivers that influence efficiency. This could involve route optimization, load consolidation, or choosing the most cost-effective shipping methods based on urgency and distance.
As consumer spending fell, the days of escalating ocean freight and extreme shipping variability eased this year. For organizations layered in functional metrics and driving a cost agenda, this is a tough nut to crack. To side-step this issue, build planning processes to use market data. What is normalcy?
Price of Ocean Shipping Business Continuity. One of my stark realizations this year is that smaller companies are beating larger and often more established companies on growth metrics, inventory turns, operating margin, and Return on Invested Capital (ROIC). (In A focus on functional metrics degrades balance sheet performance.
If you miss reading the Shaman in the next few weeks and you want some new reading in the area of supply chain excellence, consider tucking my new book Metrics that Matter into your suitcase. Today, it is rolling off the presses, as I write, and it will ship from the Amazon warehouses on December 15th.
Based on the work with Georgia Tech, we are getting clear on which metrics matter by industry. As companies adopt a balanced scorecard, the functional metrics shift to a focus on reliability. They implemented a simple planning technology with an outside-in channel-centric model (Ship to model definition). What defines maturity?
Throughout the supply chain, the use of metrics to track and understand processes provides an invaluable resource for ensuring increased production and customer satisfaction. What Distribution Center Metrics Need Tracking? However, the most important metrics can be categorized into the following eight areas. On-Time Shipping.
You’re expected to ship more orders, faster, with fewer errors — all while managing rising costs and shrinking labor pools. How much could you save by streamlining your workflows and empowering your team with real-time data? Mobile solutions automate data collection, eliminating manual entry and the errors that come with it.
In the visibility use case avoid three watch outs: 1) Make Sure That The Data Is Actionable. In many deployments of telematics, companies get visibility on truck status, but the data is an overkill. Contract manufacturing or 3PL data often will have a 24-hour latency due to batch integration. Master data. Warranty data.
Closing the gaps happens when there are aligned metrics, clarity of vision and aligned planning processes. More advanced supply chain leaders model the role of complexity (product and customer), the impact of risk, and opportunity of innovation as well as product shipping and manufacturing locations, and inventory policies.
The warehouse I ran just completed a consolidation of three shipping centers. So, I was always struggling on a daily basis to establish a feasible plan to ship 180 trucks out of 22 doors in a twenty-four-hour operation. The metrics were not aligned. Map the different metrics and incentives in the organization to behavior.
The major challenge faced by customers of real-time visibility data had always been how to operationalize what could quickly become overwhelming quantities of fast-changing information. This extensive connectivity has resulted in impressive metrics: 1.2 This extensive connectivity has resulted in impressive metrics: 1.2
Track Carrier Performance Data. Capturing carrier data gives you more visibility into your freight spend and enables you to make data-driven decisions that positively impact your business. Routing optimization continuously applies data to validate planned routes against market disruptions. a shipment?doesn’t
For retail and consumer packaged goods (CPG) companies, the busy shipping season came early. This is exacerbated when supply chain partners delay data transmission, guard their data, or omit certain data fields. The peak inbound season typically starts around this time of year.
The manufacturing firm would then have to organise shipping of the defective product, testing the product, dismantling, repairing, recycling or disposing the product. The Ultimate Guide for Effective LTL Freight Management : we put on a 60 minute webinar entitled, “Best Practices for Effective LTL Freight Management and Shipping.”
With crystal clear, up-to-the-minute, and accurate data that enables organizations to see what’s happening across their entire supply chain and take smart, decisive action. In fact, recent data shows that manufacturer inventory levels are up nearly 10% year over year. So how does a manufacturer navigate this rollercoaster?
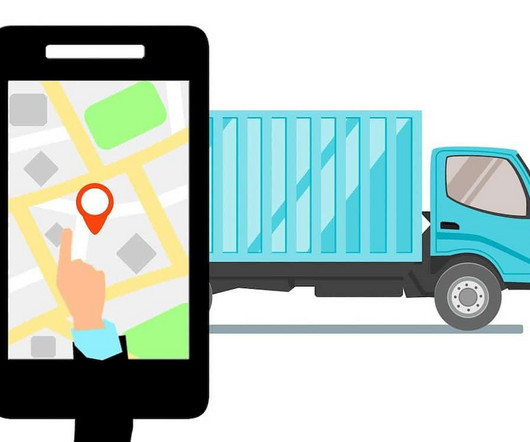
Your business is booming, orders are flying in, and you’re drowning in a sea of shipping labels and tracking numbers. Enter shipment management software—a lifesaver for businesses looking to streamline their shipping processes and maintain their sanity. Cost Savings : Find the best shipping rates and avoid costly mistakes.
According to McKinsey survey of global supply chain leaders , only 53% of respondents describe the quality of data in their supply chain planning systems as “sufficient” or “high.” ” Yet leaders with high-quality master data are 1.5x less likely to be affected by supply chain disruptions.
For Greater Product Performance Visibility and Improved Sales & Demand Planning Consumer Packaged Goods (CPG) manufacturers operate in an increasingly competitive environment, where the ability to access and analyze timely, accurate data can make or break a company’s success. This process is known as data normalization and harmonization.
In fact, a recent study , in partnership with Edelman Data & Intelligence, found a broad increased level of confidence from supply chain leaders despite peak season disruptions among those that have successfully implemented data-driven, third-party resources to manage heightened activity levels.
The manufacturing firm would then have to organize shipping of the defective product, testing the product, dismantling, repairing, recycling or disposing the product. Besides, failure of managing return logistics of such things may lead to an increased risk of exposing personal or company data.
Maersk, the world’s largest container shipping company, reported its best quarter in 117 years, posting a $5.9B Ships continue to hold in the west coast harbors of LA and Long Beach, and the west coast warehouses are full. Much of the inventory on the ships at sea will miss the essential seasonal windows.
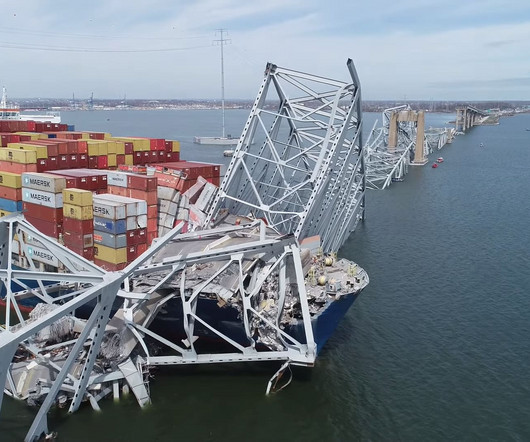
In the early morning hours of April 26, at approximately 1:35am, a cargo ship leaving Baltimore Harbor struck the Francis Scott Key Bridge, triggering a catastrophic collapse of the 1.6-mile-long The end result of the loss of propulsion was the ship crashing into the bridge. mile-long span. An estimated 11.5
Koganti urged the procurement audience to look for whats referred to as “foresight function” in planning tools, which is capable of enhancing data analysis, scenario generation and trend identification , allowing for more informed and proactive decision-making, albeit with human oversight.
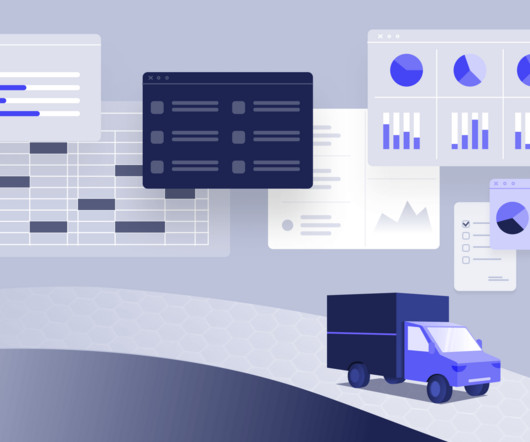
Advances in automation, data analytics, and cloud based management systems are reshaping how warehouses operate. Start by mapping the flow of materials from the moment they arrive at the receiving dock until they depart the shipping area. You shouldn’t have to worry about a disorganized warehouse as well.
Enterprise resource planning through mobile ERP solutions provides access to real-time business data via mobile devices, enhancing operational efficiency, streamlining workflows, and enabling decision-making across various business functions. No more information silos or delays — everyone operates with the same up-to-the-minute data.
Learn how to build a 2-day ground shipping network that meets customer expectations without hurting your bottom line. It’s no secret that fast shipping is a growing consumer expectation — and thanks to the Amazon effect, consumers are defining “fast” as 1-2 days. Why Most SMBs Don’t Offer 2-Day Shipping.
A planner could ask the SCP engine to achieve 95% service, with CO2 emissions under a million metric tons at a given factory in the coming month. How much of a given stock keeping unit will need to be shipped to each of our retail customer’s distribution centers in the coming week? This would be a three-way tradeoff.
Billions of venture capital dollars of investment are being poured into companies that can integrate real-time visibility data with transportation to provide a more informed ETA for shippers and carriers. The company is focused on ocean shipping. The changes measured in the Nexus solution can be based just on the data of one company.
RELATED CONTENT RELATED VIDEOS Last Mile Delivery Logistics HR & Labor Management Related Articles Airbus Reaches Deal With Canada Workers, Averting Lockout Threat Postal Workers Strike in Canada, Disrupting Holiday Shipments DHL Express Canada Offers Flat-Fee International Shipping SupplyChainBrain J.B.
We organize all of the trending information in your field so you don't have to. Join 102,000+ users and stay up to date on the latest articles your peers are reading.
You know about us, now we want to get to know you!
Let's personalize your content
Let's get even more personalized
We recognize your account from another site in our network, please click 'Send Email' below to continue with verifying your account and setting a password.


Let's personalize your content