This site uses cookies to improve your experience. To help us insure we adhere to various privacy regulations, please select your country/region of residence. If you do not select a country, we will assume you are from the United States. Select your Cookie Settings or view our Privacy Policy and Terms of Use.
Cookie Settings
Cookies and similar technologies are used on this website for proper function of the website, for tracking performance analytics and for marketing purposes. We and some of our third-party providers may use cookie data for various purposes. Please review the cookie settings below and choose your preference.
Used for the proper function of the website
Used for monitoring website traffic and interactions
Cookie Settings
Cookies and similar technologies are used on this website for proper function of the website, for tracking performance analytics and for marketing purposes. We and some of our third-party providers may use cookie data for various purposes. Please review the cookie settings below and choose your preference.
Strictly Necessary: Used for the proper function of the website
Performance/Analytics: Used for monitoring website traffic and interactions
” I advise for clients to maximize the value of SAP as a system of record and start to build the concepts and flows for the next generation of planning as a system of insights. In today’s architectures and functional metrics, value optimization does not exist. You are right.
In follow-up qualitative interviews, one of the largest issues with organizational alignment was metric definition and a clear definition of supply chain excellence. In my post Mea Culpa, I reference my work with the Gartner Supply Chain Hierarchy of Metrics. Error is error, but is it the most important metric? My answer is no.
However, as carbon taxes and emissions reporting requirements continue increasing, supply chain professionals face mounting pressures from inside and outside their organizations to measure and improve performance against new, nebulous sustainability metrics. Freight transportation makes up over 10% of total global carbon emissions.
A lack of standardized ESG metrics across industries and regions makes it challenging to consistently evaluate and compare supplier performance. Legacy procurement systems pose challenges, as they were not designed to capture and manage ESG-related data. Upgrading or adapting these systems adds technical and financial complexity.
This complexity has introduced gaps in visibility and responsiveness that traditional systems werent designed to handle. This doesnt eliminate those systems, it organizes the data they produce. The system also contributes to better forecasting accuracy. Dell reports reduced cycle times and improved productivity as a result.
This assessment helps identify whether existing systems can support DPP integration and what upgrades or changes are necessary. Assessing Infrastructure and Technological Capabilities The first step in the readiness assessment is to evaluate the organization’s IT infrastructure and data management systems.
Solvoyo has a metric they call the user acceptance rate. This metric measures the percentage of time the planners accept replenishment, transportation, or inventory plans as they are without any change in the timing of the delivery or the quantity to be delivered. If a user makes changes to the plan, they log that data.
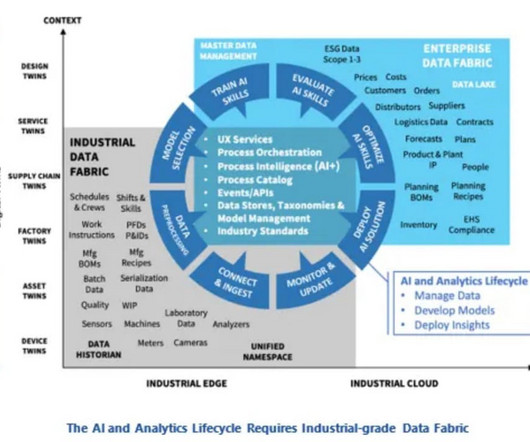
Warehouse management systems rely on RF scans of locations and products. Mr. Masson says the analytics lifecycle includes: Managing Data : Creating a business-ready analytics foundation by integrating and standardizing data across systems. We built a technology that allows us to crawl the transactional systems.
Senior leaders must think beyond incremental improvements, embracing systemic innovation to achieve significant environmental impact. Smart energy management systems further enhance efficiency by tracking and optimizing energy use in real-time. Reducing carbon emissions is a cornerstone of this effort.
Functional Metrics and the Lack of Alignment to Strategy. This year, the shiny object is AI (artificial intelligence) and touchless systems. Few companies are clear on the number of supply chains they operate, design the rhythms and cycles of each, and align metrics to the strategy. The Lovefest with Shiny Objects. The reason?
How to Get the Most Out of Your Labor Management System Using Engineered Labor Standards to Impact Warehouse Output. You were smart enough to invest in a tier one labor management system (LMS), but is your LMS smart enough to deliver the productivity you expected? The Difference Between SVS and MVS. Ad infinitum.
Note to the reader: we selected these metrics for the balanced scorecard for the analysis after work with Arizona State University to understand which metrics, in combination, most closely correlated with market capitalization. My reply to my friend is that “The supply chain is a complex non-linear system.
They recognized that many other 3PLs would have the same problem, so they created RocketFuel , a recharge metering system that ensures upfront payments for every shipment with an automated metering system. Seamless Integration: Integrates with most Warehouse Management Systems (WMS) and accounting software for smooth operation.
With freight transport accounting for a significant share of global emissions, efforts to improve logistics now extend beyond operational metrics to include resilience, regulatory compliance, and climate performance. The global freight sector faces growing pressure to balance cost-efficiency with environmental responsibility.
billion rate data points monthly to provide the most comprehensive view of the market, helping you identify savings opportunities and make data-driven decisions. Our platform can be deployed alongside your current solutions, providing immediate value without disrupting established workflows.
Critical practices include: Circular Supply Chains: Designing systems that minimize waste and emphasize recycling and reuse. Innovative tools provide actionable insights and improve operational efficiency Artificial Intelligence (AI): AI systems optimize routing and demand forecasting, reducing energy consumption and empty miles.
Similarly, UPS uses its ORION system, which integrates real-time and historical data to optimize delivery routes, saving fuel and enhancing delivery reliability. Compatibility with legacy systems adds another layer of complexity, as older data formats and technologies can complicate seamless integration.
Balancing these priorities requires investment in robust auditing systems, supplier education, and long-term partnerships that emphasize shared values. Public Reporting: Publishing sustainability reports and ethical compliance metrics to highlight progress and areas of improvement.
The research methodology for the Supply Chains to Admire compares the performance of a company against its industry peer group for the metrics of Year-over-Year Revenue Growth, Inventory Turns, Operating Margin, and Return on Capital Employed (ROCE). For 80% of industries, the supply chain metrics represent more than 40% impact on value.
The issue is that when companies optimize functional metrics, they throw the supply chain out of balance and sub-optimize value. Planners evolved in the 1980s when planning systems were not scalable and memory was expensive. The most efficient supply chain (in terms of lowest cost) is not the most effective. The reasons are many.
The supply chain is a complex non-linear system. At each company, there is a relationship between the metrics of growth, margin, inventory, customer service, and asset strategy. For the purpose of this article, I will use Return on Invested Capital (ROIC) as the proxy metric to discuss asset utilization.) My learning?
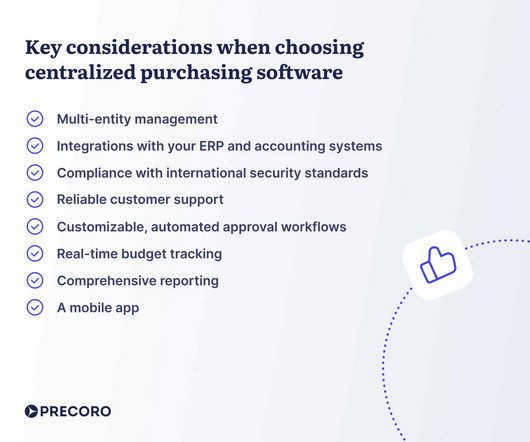
On top of that, we’ll break down how to approach selecting the right centralized purchasing system for your business needs. Signs your company needs a centralized purchasing system Key benefits of centralized procurement How to efficiently implement centralized procurement Frequently Asked Questions What is centralized purchasing?
All of this points to a larger issue: systems that perform well under stable conditions but lack the flexibility to respond when those conditions change. For example, AI-enabled systems can monitor global trade activity, policy changes, and even weather patterns to flag emerging risks before they impact operations.
We’ll examine the key components of efficient supply chains, explore essential performance metrics, and uncover the fundamental drivers that influence efficiency. Production: Efficient production systems maximize resource utilization through standardized procedures.
Their focus on technology for the sake of digital–doing the same things faster or hands-free–stalled out because of the lack of investment in human work systems. “Why would we invest in making current systems faster without recognizing the fundamental disconnects??? . What Does It Mean For Work Systems?
Thats why modern BI systems are quickly becoming the go-to solution for data-driven enterprises. The best systems feature these five components: A Unified Data Hub Centralizes and harmonizes data for one-number reporting and consistent insights. Think of it as the central nervous system of your analytics ecosystem.
A disruption at any point in the global logistics network including the average of 12 touch points from shipment packaging to final delivery can prove disastrous for profits, service levels, customer loyalty, and other key metrics. With the global e-commerce market predicted to reach $8.1
The systems–based on shipment and order data–were out of step with the market. With fixed models and hard-wired data feeds, teams could not adjust the planning systems to use consumption data or market indicators. In addition, build a planning master data management system. I love the metaphor of watermelon metrics.
Connected technology transforms traditional supply chains into dynamic systems capable of real-time decisions and proactive problem-solving. Inventory Management Systems Integrated inventory management systems use data analytics to keep ideal stock levels.
Many large organizations have multiple systems for order, warehouse, or transportation management that are barely integrated frequently not at all. Effective fulfillment requires a well-designed system, efficient logistics, and a reliable supplier network to ensure timely and accurate delivery of products.
We consistently see that companies focused on functional excellence–a focus within a functional silo like manufacturing, transportation or distribution– or singular metrics– like inventory or costs– underperform against their peer groups. Reward teams for cross-functional metrics.
Functional Metrics. With the implementation of transactional systems, the focus was on measuring and controlling functional metrics like the lowest manufacturing cost or purchase price variance in procurement. Few consultants understand the supply chain as a complex non-linear system. False Beliefs.
Understanding Modern Warehouse Mobility Solutions for Enhanced Warehouse Productivity Mobile warehouse solutions combine portable devices, specialized apps, and real-time data systems to boost operational efficiency. Paperless Warehouse Management System Going paperless with mobile devices streamlines task management.
billion rate data points monthly to provide the most comprehensive view of the market, helping you identify savings opportunities and make data-driven decisions. Our platform can be deployed alongside your current solutions, providing immediate value without disrupting established workflows.
To address these return-driven challenges, the industry is moving away from siloed solutions toward integrated systems that seamlessly connect Merchandise Financial Planning , Assortment Planning , Allocation , and Demand Forecasting.
Misaligned priorities, siloed systems, and unclear ownership can directly impact key performance indicators like cost savings percentage and procurement cycle time. These agreements often include performance metrics, sustainability requirements, and service-level expectations that are continuously monitored.
What is the Perfect Delivery Metric? Improving on this metric will always involve a focus on people and processes, but often also includes implementing new, more robust, supply chain applications. The wrong metrics drive suboptimal behaviors and metrics can often be manipulated.
Why Traditional Stock Management Fails During Disruptions When unexpected disruptions occur, conventional inventory systems fail to adapt quickly enough, resulting in costly delays, critical shortages, excessive overstock, and damaged customer relationships.
Modern ML-powered demand planning systems simplify this by analyzing multiple factors simultaneously – product trends, competitive pricing, market conditions, and social media activity – to uncover patterns in promotional events and quantify their precise effect on sales.
The SAS forecasting system implemented in 2019 was not tested for model accuracy. It is my hope that we can side-step political discussions demonstrated in my stories and ground the problem solving in scientific methods to understand the properties of data, the potential of supply chains through modeling, and the alignment of metrics.
For organizations layered in functional metrics and driving a cost agenda, this is a tough nut to crack. During the pandemic, companies struggled with planning systems turning off the optimizers, and using the technology as a system of record. To accomplish this goal avoid hardwiring planning platforms to transactional systems.
How are companies rethinking their liquidity management strategies in response to the recent degradation across major working capital metrics? In the wake of economic uncertainty, many companies have experienced a degradation in key working capital metrics.
In our discussion, we attempted to characterize and separate his performance from system issues. I was promoted to run the warehouse, and at the time, I had no experience in distribution, but was asked to run the largest distribution center in the system. The metrics were not aligned. Sometimes, this is a tough discussion.
It’s about building adaptable systems, establishing clear performance indicators, and implementing processes that can handle growth spurts and market fluctuations. Advanced Automation Systems: Seamless integration of automation is essential for digital manufacturing. Upgrades and expansions may be necessary.
We organize all of the trending information in your field so you don't have to. Join 102,000+ users and stay up to date on the latest articles your peers are reading.
You know about us, now we want to get to know you!
Let's personalize your content
Let's get even more personalized
We recognize your account from another site in our network, please click 'Send Email' below to continue with verifying your account and setting a password.


Let's personalize your content