This site uses cookies to improve your experience. To help us insure we adhere to various privacy regulations, please select your country/region of residence. If you do not select a country, we will assume you are from the United States. Select your Cookie Settings or view our Privacy Policy and Terms of Use.
Cookie Settings
Cookies and similar technologies are used on this website for proper function of the website, for tracking performance analytics and for marketing purposes. We and some of our third-party providers may use cookie data for various purposes. Please review the cookie settings below and choose your preference.
Used for the proper function of the website
Used for monitoring website traffic and interactions
Cookie Settings
Cookies and similar technologies are used on this website for proper function of the website, for tracking performance analytics and for marketing purposes. We and some of our third-party providers may use cookie data for various purposes. Please review the cookie settings below and choose your preference.
Strictly Necessary: Used for the proper function of the website
Performance/Analytics: Used for monitoring website traffic and interactions
Ken Adamo and Joe Lynch discuss a trillion dollars in freight transactions. Ken is the Chief of Analytics at DAT Freight & Analytics. DAT operates the largest truckload freight marketplace in North America. About Ken Adamo Ken Adamo serves as the Chief of Analytics at DAT Freight & Analytics.
However, as carbon taxes and emissions reporting requirements continue increasing, supply chain professionals face mounting pressures from inside and outside their organizations to measure and improve performance against new, nebulous sustainability metrics. Freight transportation makes up over 10% of total global carbon emissions.
billion rate data points monthly to provide the most comprehensive view of the market, helping you identify savings opportunities and make data-driven decisions. billion rate data points monthly to provide the most comprehensive view of the market, helping you identify savings opportunities and make data-driven decisions.
FreightWaves has announced that Leland Miller, CEO of China Beige Book International, will deliver a keynote address at the upcoming Future of Freight Festival (F3) this November. The event, a premier gathering for freight and logistics leaders, promises to equip attendees with forward-looking strategies amid ongoing U.S.-China
billion rate data points monthly to provide the most comprehensive view of the market, helping you identify savings opportunities and make data-driven decisions. billion rate data points monthly to provide the most comprehensive view of the market, helping you identify savings opportunities and make data-driven decisions.
An efficient supply chain strategy is one that takes every aspect of your supply chain into account, from inventory management and warehouse design to freight tendering and transport optimisation. Inventory Management The key starting point is implementing proper ABC analysis, and you need to look at it from multiple angles.
In today’s fast-moving supply chain environment, data is as valuable as the freight itself. Cost analysis may be retrospective , limiting proactive interventions. Lack of Verification Errors in freight bills (often 3-8% of total spend) go unnoticed. However, this data often suffers from: 1.
For example, switching from air to ocean freight for non-time sensitive shipments can reduce carbon emissions by up to 95% per unit shipped. This means developing supplier evaluation frameworks that include carbon metrics, working together on joint emission reduction projects, and incentivising suppliers to meet or beat carbon targets.
Springs said, “We’re seeing consistent increases in safety metrics.” While we always aim to improve these metrics, it’s not just about numbers — it’s about caring for our people.” Nutrien Ag Solutions, using Samsara’s technology, saw a major reduction in incidents since adopting the platform three years ago.
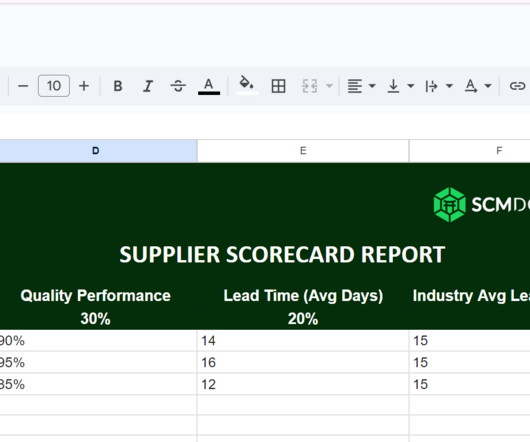
Running procurement and supply chain without metrics is like driving blindfolded. Decoding the Metrics: What Are They Telling You? This metric is used to measure the efficiency and reliability of carriers in meeting their pickup commitments. Action: Conduct a spend analysis to identify consolidation opportunities.
Look for features like: Shipment Reports Performance Metrics Cost Analysis These insights can help you identify trends, pinpoint inefficiencies, and optimize your shipping strategy. Your shipment management software should provide detailed reports and analytics to help you make informed decisions.
Tie rewards directly to the metrics that move your business forward. Think reduced inventory shrinkage, increased on-time deliveries, or successfully negotiated freight contracts. ” Instead, try “Your meticulous data analysis caught that reporting error and saved us thousands!”
While CPI is normally used within project management and earned value analysis, it has significant application and importance within supply chain contexts, particularly in procurement, logistics and warehousing. One way to assess the cost performance of any function within the supply chain is through Cost Performance Index (CPI).
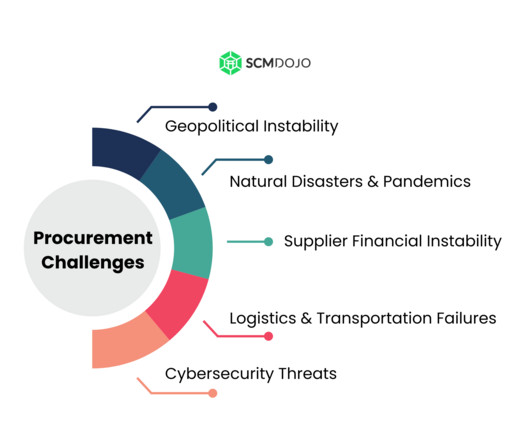
Strengthen Third-Party Vendor Security Your logistics business relies on a network of partners, including shipping carriers, freight brokers, and software providers. After resolving the incident, conduct a post-mortem analysis to detect weaknesses and improve future defenses.
Artificial intelligence-driven platforms are transforming carbon accounting by automating data collection and analysis. By contrast, companies that digitize their carbon tracking shorten the learning curve and accelerate progress toward their sustainability goals. AI also provides visibility into emissions across the supply chain.
Koganti urged the procurement audience to look for whats referred to as “foresight function” in planning tools, which is capable of enhancing data analysis, scenario generation and trend identification , allowing for more informed and proactive decision-making, albeit with human oversight.
When pricing decisions are grounded in comprehensive data analysis and scenario modelling, businesses can move decisively while others hesitate, uncertain of the implications of their choices. In addition to speed, the key differentiator when it comes to advanced pricing technology is informed confidence.
Management believes that investors and financial analysts measure our business on the same basis, and we are providing the Adjusted EBITDA financial metric to assist in this evaluation and to provide a higher level of transparency into how we measure our own business.
Use tools like business credit reports, payment history analysis, and trade references to evaluate customer financial stability and identify early warning signs of potential payment delays. Supply Chain Finance & Revenue Management Lawyer for 737 Crash Victim Families Slams DOJ Deal with Boeing Quality & Metrics U.S.
Supply chain reports are data-driven documents that provide key metrics and insights into various aspects of your supply chain, including: Inventory Levels Tracking stock levels in real-time to ensure adequate inventory to meet demand while minimizing holding costs. What are Supply Chain Reports?
So argues Greg Petro, CEO of First Insight , a retail platform that uses AI analysis of consumer feedback to predict demand, determine pricing thresholds and model scenarios around, for example, differing tariff levels or supply chain bottlenecks.
Companies must automate analysis of their product flows and fixed global networks. But fewer than 30% have integrated real-time threat monitoring into their day-to-day decision-making. The risk is clear; the response is not yet sufficient. What can you do? They must integrate real-time threat intelligence with planning and execution systems.
States Photo: iStock.com/ ronnachaipark July 10, 2025 SupplyChainBrain With no end in sight to the truck driver shortage, many freight firms plan to raise wages and make efforts to improve drivers’ work-life balance, according to a 2025 Logistics Report from Tech.co, a research, analysis and news provider. Some 56% of U.S.
Reduce freight and logistics costs. Use Spend Analysis and Dashboards Spend analysis is a powerful way to track, evaluate, and understand how and where money is being spent across your organization. Dashboards are visual tools that make spend analysis come to life.
Financial performance metrics are valuable as they capture the economic consequences of business decisions. Where is the metric for determining the sources and uses of cash from three perspectives - operational, investment and financial? Michael Hurd Lean Consultant, Unemployed Posted on: Jun, 10 2017 A Very Good Article.
Global Supply Chain Management The Hydrogen Advantage for Commercial Trucking LTL/Truckload Services NIH to Study Health Impacts from East Palestine Derailment Rail & Intermodal Let’s Talk WMS: 2025 Gartner Magic Quadrant Findings and Market Analysis Webinars Digital Edition SupplyChainBrain 2025 ESG Guide: Is ESG Still Relevant?
Freight volumes were mixed but mostly down, as the “freight recession” continued on now for more than two years. The Freight Tonnage Index from the ATA for June showed volumes in Q2 basically flat versus Q1, up just 0.2%. Financial performance metrics are valuable as they capture the economic consequences of business decisions.
Financial performance metrics are valuable as they capture the economic consequences of business decisions. Where is the metric for determining the sources and uses of cash from three perspectives - operational, investment and financial? Michael Hurd Lean Consultant, Unemployed Posted on: Jun, 10 2017 A Very Good Article.
Financial performance metrics are valuable as they capture the economic consequences of business decisions. Where is the metric for determining the sources and uses of cash from three perspectives - operational, investment and financial? Michael Hurd Lean Consultant, Unemployed Posted on: Jun, 10 2017 A Very Good Article.
Global Supply Chain Management The Hydrogen Advantage for Commercial Trucking LTL/Truckload Services NIH to Study Health Impacts from East Palestine Derailment Rail & Intermodal Let’s Talk WMS: 2025 Gartner Magic Quadrant Findings and Market Analysis Webinars Digital Edition SupplyChainBrain 2025 ESG Guide: Is ESG Still Relevant?
Now, he’s focused on delivering cutting-edge solutions to Fortune 1000 companies, helping them streamline both strategic and operational processes for maximum value.
They’re one step closer to that realization of the full integration of robotics,” said Rueben Scriven, research manager at Interact Analysis, a robotics technology research firm. Analysis by the Journal found that the average number of employees Amazon had per facility last year, roughly 670, was the lowest recorded in the past 16 years.
Financial performance metrics are valuable as they capture the economic consequences of business decisions. Where is the metric for determining the sources and uses of cash from three perspectives - operational, investment and financial? Michael Hurd Lean Consultant, Unemployed Posted on: Jun, 10 2017 A Very Good Article.
Click here to send us your comments In response, the National Motor Freight Traffic Association (NMFTA) has just released a framework it says can help shippers, carriers and brokers fight back against the growing and increasingly sophisticated threat of digitally enabled cargo theft. What do you say?
In the first facility management was focused on controlling the workforce through individual metrics. Financial performance metrics are valuable as they capture the economic consequences of business decisions. As I walked I found a wonderfully clear example of the difference that mutual respect for people makes.
Eurasian Rail Freight: Demand for rail freight between Asia and Europe has surged, leading to congestion and longer booking times. Financial performance metrics are valuable as they capture the economic consequences of business decisions. Contingency planning for alternative ports is essential.
Click here to send us your comments That according to a recent blog post by the maritime analysts at Drewry, which noted that “More than five years have passed since the huge shipping disruptions, damaging port congestion, and cost spikes of the Covid period, but one feature has remained: freight rate volatility.”
Financial performance metrics are valuable as they capture the economic consequences of business decisions. Where is the metric for determining the sources and uses of cash from three perspectives - operational, investment and financial? Michael Hurd Lean Consultant, Unemployed Posted on: Jun, 10 2017 A Very Good Article.
All that is distant memory now, as the maker of freight trucks powered by hydrogen fuel cells announced it had begun selling off its assets. Financial performance metrics are valuable as they capture the economic consequences of business decisions. Michael Hurd Lean Consultant, Unemployed Posted on: Jun, 10 2017 A Very Good Article.
China-US air freight tumbles on 'de minimis' tariff; airlines adjust routes Air freight capacity between China and the U.S. US freight industry hopes for back-to-school demand boost after tariff truce A 90-day trade thaw between Washington and Beijing could prove to be a welcome reprieve for the U.S.
Advertise Contact Us Supplier Directory SCB YouTube About Us Login Subscribe Logout My Profile LOGISTICS Air Cargo All Logistics Facility Location Planning Freight Forwarding/Customs Brokerage Global Gateways Global Logistics Last Mile Delivery Logistics Outsourcing LTL/Truckload Services Ocean Transportation Parcel & Express Rail & Intermodal (..)
The monthly report from Cass and partner Tim Denoyer of ACT Research is based on data from the billions of dollars of freight bills that Cass pays for its shipper clients. in 2024, and so far is trending toward another decline in 2025, Cass says, as carriers navigate the lousy freight environment. Supply Chain Digest Says.
Meanwhile, our supply chain and logistics stock index, which is made up of more than 20 stocks across freight carriers, logistics service providers, and supply chain hardware and software vendors, lagged the S&P, with a gain of just 10.3% in the past year, using an unweighted average of the 22 stocks in the index.
We organize all of the trending information in your field so you don't have to. Join 102,000+ users and stay up to date on the latest articles your peers are reading.
You know about us, now we want to get to know you!
Let's personalize your content
Let's get even more personalized
We recognize your account from another site in our network, please click 'Send Email' below to continue with verifying your account and setting a password.


Let's personalize your content