This site uses cookies to improve your experience. To help us insure we adhere to various privacy regulations, please select your country/region of residence. If you do not select a country, we will assume you are from the United States. Select your Cookie Settings or view our Privacy Policy and Terms of Use.
Cookie Settings
Cookies and similar technologies are used on this website for proper function of the website, for tracking performance analytics and for marketing purposes. We and some of our third-party providers may use cookie data for various purposes. Please review the cookie settings below and choose your preference.
Used for the proper function of the website
Used for monitoring website traffic and interactions
Cookie Settings
Cookies and similar technologies are used on this website for proper function of the website, for tracking performance analytics and for marketing purposes. We and some of our third-party providers may use cookie data for various purposes. Please review the cookie settings below and choose your preference.
Strictly Necessary: Used for the proper function of the website
Performance/Analytics: Used for monitoring website traffic and interactions
Spend analysis is often the entry point. This blog offers a clear, practical overview of what spend analysis is, how it supports strategic sourcing, and why it matters for both direct and indirect procurement. Schedule a demo of Ivalua’s Spend Analysis solution today!
The company, heavily invested in Canadian manufacturing, faced a crisis because its raw materials were sourced from outside North America, disqualifying it from USMCA tariff exemptions. Establish inventory reserves in key markets to avoid supply chain disruptions.
This is amplified across the supply chain into an exponential impact on inventory and planned orders for manufacturing. Inventory Health. I find only 8% of companies actively measure inventory health. Few organizations have the ability to manage the form & function of inventory. Hire a consultant to do the analysis.
Optimizing fulfillment requires a series of steps to get a shipment from its source to the end customer. These steps include sourcing and receiving inventory, storing inventory, order processing, picking and packing an order, shipping the order, and returns management.
They integrate AI into demand forecasting, inventory optimization, and logistics operations to improve efficiency, reduce costs, and mitigate risks. Limitations of Traditional Supply Chain Planning Traditional supply chain planning relies on retrospective analysis. Amazon is a leader in AI-driven supply chain management.
For companies that want to go beyond the traditional spreadsheet, which cannot handle this ocean of information efficiently, statistical methods such as cluster analysis can help. What is Cluster Analysis? Cluster analysis is a statistical umbrella term for methods that classify data points according to their attributes.
Technological Advancements Real-time inventory tracking and predictive analytics give leading firms a competitive edge. Winning the Supply Chain Wars To thrive amidst these challenges, ToolsGroup recommends five strategic pillars: Conduct What-If Scenario Analysis Simulate potential disruptions to plan and respond proactively.
Before you ask, yes, there are design and simulation technologies–even a digital twin or two–but these technologies are usually deployed as ad-hoc analysis deep within a function and not used holistically. The data outcome is open source and can be used to improve project outcomes. The answer is not th e Gartner Top 25.
From raw material sourcing to logistics and regulatory compliance, stakeholders across the value chain will need to prepare for structural adjustments. Sourcing and Ingredient Availability A central impact of this policy is the need to replace synthetic colorants with natural alternatives. Production scheduling may also be affected.
From sourcing and bid evaluation to warehouse slotting and dynamic routing, AI tools support faster and more consistent outcomes by processing large volumes of operational data and identifying patterns that human decision-makers may overlook.
Even more impressive, lost sales due to stockouts can decrease by up to 65%, while inventory reductions of 20% to 50% are possible. Enhanced Promotions and Events Analysis Promotions, advertising campaigns, and trade events are vital components of marketing strategy, but accurately measuring their impact on demand remains challenging.
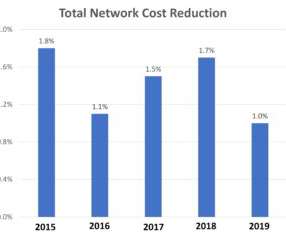
Downsizing inventories over the past decade crippled the response.” In Table 1, I share research collected for the Supply Chains to Admire analysis on the average days of inventory by industry across the period of 2004 to 2019 by increments to match economic shifts. Days of Inventory Peer Group Across Time Periods.
data extractors, search APIs) to perform tasks, enabling them to dynamically adjust to new information and real-time knowledge sources. Real-time data processing and analysis are crucial for identifying and resolving supply chain disruptions.
What is the role of make, source, and deliver? In our work with Georgia Tech using data from 1982-2023, we find that the R² of the Regression analysis of Cost-of-Goods Sold/Inventory Turns when compared to correlations of Operating Margin/Inventory turns to Market Capitalization/employee is 40-65% lower.
Supply chain was defined in 1982 as interoperability between source, make and deliver. But more importantly, few see demand as a process to be managed through lean processes of disciplined analysis of demand shaping/shifting analysis, backcasting, improving models and driving FVA improvements. Why is a reinvention needed?
Industry-specific content is available for processes like Source to Settle, Procure to Pay, Order to Cash, and more. Predictive and prescriptive AI addresses use cases like inventory optimization, asset health predictions, yield optimization, and financial forecasting. Key features include Multi-tier Mapping and Trace Request.
The pace and scope of supply chain disruption are beyond human cognition, manual analysis, and consumer-grade spreadsheet tools. Teams are constrained by their physical resources, like trucks, inventory, and labor capacities, as they seek to resolve a disruption.
When tariffs hit, crucial components that were once affordable can become prohibitively expensive, forcing companies to rethink their sourcing and production strategies. Key takeaway Top challenge: Sourcing volatility driven by EV component shortages and fluctuating global tariffs.
by Richard Cushing In part one of my inventory management best practices series I argue that inventory cannot be managed until it is controlled, and present the notion our general willingness to apportion blame upon unreliable data from enterprise resource planning (ERP) systems is misplaced.
They write, “This includes tackling bigger issues such as compliance, supplier relationship management, risk and disruption, responsible sourcing, and transparency. IoT devices track inventory in real time, providing valuable insights into stock movement, reducing waste, and ensuring products are available when needed.”
For my long-time readers, you know that fewer than 3% of companies outperform their peer group in our Supply Chains to Admire analysis , and that the Gartner Top 25 is essentially a beauty contest for underperformers. The third step is to do a data inventory. But, as the dust settles, is there value? And what is value?
This eliminates the need for lengthy back-and-forth communications and manual data entry by delivering a single source of truth. A significant advantage of GenAI in S&OP is the automation of complex data analysis. Elevating the Supply Chain Employee Experience with Insight Alignment is not the only issue for supply chain teams.
While consumers may see some short-term benefit in the form of discounted goods, many retailers have had to reset investor expectations , reflecting the expected hit on margins from carrying so much inventory. Inventory management is challenging enough in normal times. So, what is it going to take to enable better inventory management?
Inventory is the lifeblood of any manufacturing business. By leveraging analytics and key performance indicators (KPIs), manufacturers can optimize inventory, reduce waste, and boost profitability. Tracking inventory flow and performance across your supply chain is a must. Thats where data-driven decision-making comes in!
A resilient supply chain incorporates alternative sources, carriers, routes, and other characteristics so that it can flex in response to a situation. To build supply chain resiliency, leaders should consider these factors: Buffer inventory and shift away from JIT.? Your plan should address technology, processes, and people.
At each company, there is a relationship between the metrics of growth, margin, inventory, customer service, and asset strategy. When we compare the results of P&G to its peer group for 2012-2021, P&G outperforms in inventory turns and margin but underperforms in growth and asset utilization. The analysis was too short-term.
Clear operating strategy and definition of supply chain excellence across plan, source, make and deliver. I like the use of growth, margin, inventory turns, Return on Invested Capital, customer service and ESG metrics. Holistic design of the form and function of inventory with a focus on setting inventory targets for each flow.
Analysis Transpacific container rates to the West Coast doubled last week on June 1st GRIs to $5,488/FEU, with the latest daily rates above $6,000/FEU as shippers start peak season early and frontload goods ahead of tariff pause expirations in July and August. America weekly prices fell 1% to $5.27/kg. China – N. Europe – N.
It’s the key to transforming your supply chain from a source of frustration into a well-oiled, profit-generating machine. Data analytics also offers actionable insights for: Inventory Management: See stock levels across multiple locations in real-time. That’s where data analytics comes in. The result?
Pattern recognition is the ability to discern patterns in data and use the insights for further analysis. This data source synchronizes corporate reporting across global markets while tracking restatements, name changes, and currency shifts.) The second part of the story is that inventory turns for Lenovo are 10.8,
Over the last six years, we studied the connection between business results (growth, operating margin, inventory turns and Return on Invested Capital (ROIC)) and the link to company characteristics. We like the metrics of growth, on-time and in-full orders, operating margin, inventory turns, and Return on Invested Capital (ROIC).
It leverages historical data, competitive intelligence, and external factors to guide inventory planning and resource allocation. Image source: Stefan de Kok 2. For example, Aston Martin faced growing demands from an international clientele and needed to improve first-time availability without increasing inventory.
While I was preparing for surgery, Gartner released the Gartner Top 25 Analysis. The analysis is now in its ninetieth year. The Gartner analysis is biased toward companies within the Gartner network. Semiconductor Industry Analysis Would you feel better about your results if you were Intel or TSMC? The reason?
Use of optimization to consume planned orders into manufacturing scheduling and distribution requirements planning (including inventory optimization of safety stock). In this traditional definition of a supply chain model, I define a good plan as: A positive Forecast Value Added (FVA) analysis/output for the forecast with minimal bias. (I
Collaborative discussions can help identify relevant data sources and metrics that capture the end-to-end supply chain process and align with overall business goals. Data inventory and assessment: Conduct a comprehensive inventory of available data sources within the organization, including internal systems (e.g.,
Mr. Frasquet is the executive director of corporate procurement, although his responsibilities include a much broader set of supply chain responsibilities than just sourcing. This digital twin contains network costs – the inventory carrying cost is X for this product, by Y for this one.
The research methodology for the Supply Chains to Admire compares the performance of a company against its industry peer group for the metrics of Year-over-Year Revenue Growth, Inventory Turns, Operating Margin, and Return on Capital Employed (ROCE). The methodology is now 20 years old. No planning technology today can do this.
Sources: U.S. Well, an analysis of US import container volumes 1 as a share of consumer spending 2 in 2021 and 2022 to date implies that every $1,000 in ocean freight costs per forty-foot container accounts for 0.09% of personal consumption expenditures each year. Between May and September of 2021 alone rates tripled.
Manufacturing can not only use IoT for manufacturing, but also to give inventory management greater flexibility and improve decision-making. How IoT works with inventory With inventory management being a key factor in profitability and cost containment, active inventory management is essential.
A successful plan requires design, collaboration, simulation, what-if analysis, and closed-loop learning. I find successful teams learn more about operational potential through what-if analysis than wrote use of the first plan generated in a batch job. What do we learn through gap analysis? Future for Probabilistic Planning?
Lab work testing follows vital sign analysis. ” Or alternatively, “Is there data that could be sourced to help?” When I asked for an analysis of the customer service data with a root cause analysis, it was not available. Use the peer group analysis to establish realistic targets. inventory turns.
If S&OP efforts were that effective, don’t you think that we would have made more progress against inventory levels, margin, and growth? Only 2% of companies are pushing forward in our Supply Chains to Admire analysis. Go to the source. Don’t you find the number of “experts in S&OP a bit humorous?
Optimal sourcing plant is different for different periods A baseline optimization model shows that depending on the period (month), the optimal sourcing location varies. While this sourcing strategy is the most cost-effective one, the business might not want to operate like that. In scenario #1 the horizon is 12 months.
Tom, the colorful warehouse manager, constantly heckled Frank for the increasing inventory levels while Ed, the quiet material/logistics manager, constantly questioned if there was a better way. He felt that inventory was no problem, he would just cut it at the end of each quarter to make the balance sheet goals.
We organize all of the trending information in your field so you don't have to. Join 102,000+ users and stay up to date on the latest articles your peers are reading.
You know about us, now we want to get to know you!
Let's personalize your content
Let's get even more personalized
We recognize your account from another site in our network, please click 'Send Email' below to continue with verifying your account and setting a password.


Let's personalize your content