This site uses cookies to improve your experience. To help us insure we adhere to various privacy regulations, please select your country/region of residence. If you do not select a country, we will assume you are from the United States. Select your Cookie Settings or view our Privacy Policy and Terms of Use.
Cookie Settings
Cookies and similar technologies are used on this website for proper function of the website, for tracking performance analytics and for marketing purposes. We and some of our third-party providers may use cookie data for various purposes. Please review the cookie settings below and choose your preference.
Used for the proper function of the website
Used for monitoring website traffic and interactions
Cookie Settings
Cookies and similar technologies are used on this website for proper function of the website, for tracking performance analytics and for marketing purposes. We and some of our third-party providers may use cookie data for various purposes. Please review the cookie settings below and choose your preference.
Strictly Necessary: Used for the proper function of the website
Performance/Analytics: Used for monitoring website traffic and interactions
To build an outside-in model, and use new forms of analytics, we must start the discussion with the question of, “what drives value?” For example, if I improve the cost structure in transportation, procurement, manufacturing and sales independently, what decision support framework decides the right trade-offs?
However, as carbon taxes and emissions reporting requirements continue increasing, supply chain professionals face mounting pressures from inside and outside their organizations to measure and improve performance against new, nebulous sustainability metrics. Freight transportation makes up over 10% of total global carbon emissions.
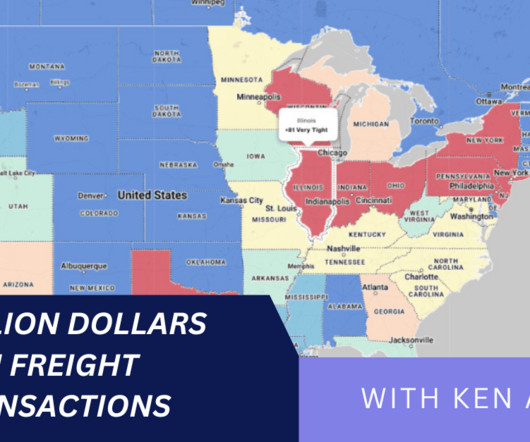
Ken is the Chief of Analytics at DAT Freight & Analytics. About Ken Adamo Ken Adamo serves as the Chief of Analytics at DAT Freight & Analytics. Prior to his career in logistics, Adamo worked in pricing and analytics at a deregulated energy provider.
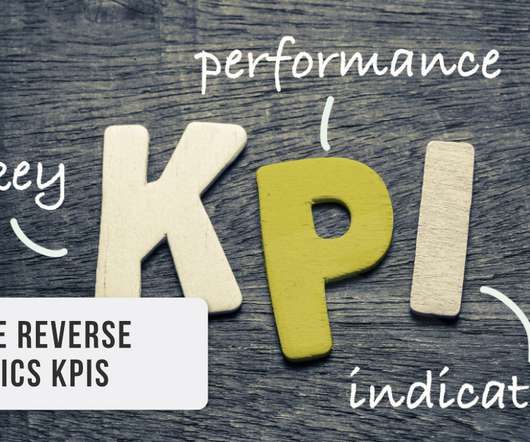
Companies across the globe have taken note of the value of big data analytics in logistics and how tracking key performance indicators (KPIs) and core metrics can dramatically affect supply chain performance. The post 5 More Reverse Logistics Metrics to Track appeared first on Transportation Management Company | Cerasis.
Transportation, warehousing, and manufacturing collectively contribute significantly to carbon emissions, making these areas critical for meaningful change. Similarly, shifting freight from road to rail or waterways offers lower-emission alternatives for long-haul transport. Efficiency is a vital component of economic sustainability.
Samuel Parker and Joe Lynch discuss DAT iQ: the metrics that matter. Samuel is Director of Product Marketing at DAT Freight & Analytics ‘ Shipper segment. About Samuel Parker Samuel is the Associate Director for DAT Freight & Analytics’ Shipper segment. He lives in Denver, Colorado with his wife and son.
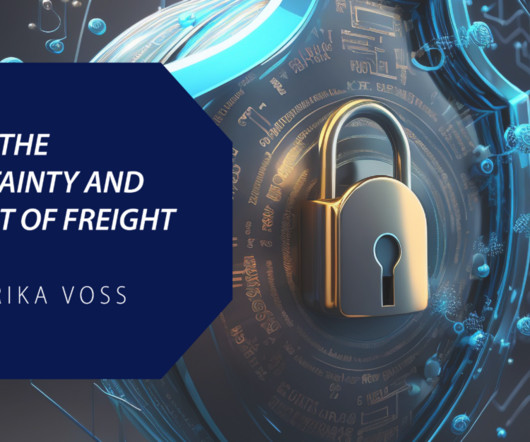
Erika is Vice President of Information Security at DAT Freight & Analytics, the largest truckload freight marketplace in North America. Currently Vice President of Information Security at DAT Freight & Analytics, she leads the vision, strategy, and execution of advanced security protections. Erika holds a Ph.D.
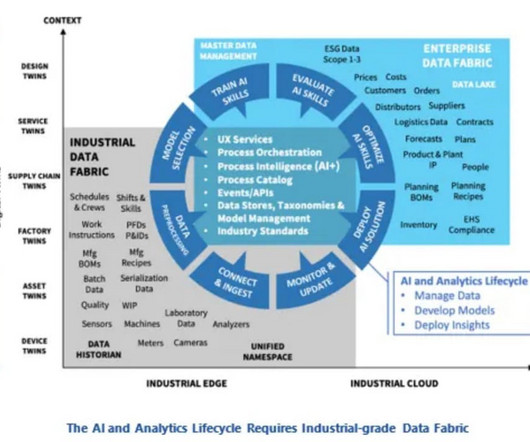
Data fabrics need to work across an AI and Analytics lifecycle. Mr. Masson says the analytics lifecycle includes: Managing Data : Creating a business-ready analytics foundation by integrating and standardizing data across systems. Not all the transactional data, just the data required to calculate a metric or make a decision.
Solvoyo has a metric they call the user acceptance rate. This metric measures the percentage of time the planners accept replenishment, transportation, or inventory plans as they are without any change in the timing of the delivery or the quantity to be delivered. We have lots of functions, lots of analytics, lots of reports.”
Managing OTR transportation through disruption is a complex process. We’re sharing seven best practices to improve OTR transportation management, enabling shippers to stay competitive in the face of disruption. Analytics provides visibility into your transportation network and operations. Across OTR Transportation Modes.
Road freight alone accounts for approximately 7% of global CO2 emissions, with maritime and air transport further amplifying the environmental burden. Key strategies include: Electrification of Transport: The use of electric vehicles (EVs) for freight and last-mile delivery reduces emissions and operational costs.
With freight transport accounting for a significant share of global emissions, efforts to improve logistics now extend beyond operational metrics to include resilience, regulatory compliance, and climate performance. The global freight sector faces growing pressure to balance cost-efficiency with environmental responsibility.
Many large organizations have multiple systems for order, warehouse, or transportation management that are barely integrated frequently not at all. Ability to Meet Fulfillment Goals According to the survey, only a mere 1% of respondents achieve 80% or higher for their OTIF metrics, with the average percentage of OTIF being a mediocre 62.21%.
Relying on proactive rather than reactive analytics, and the ability to make specific actionable callouts from these data sets, will be key to navigating the ever-changing shipping landscape both now and in the future. Although very informative in their own right, retrospective analytics cannot undo the past. Enter proactive analytics.
A disruption at any point in the global logistics network including the average of 12 touch points from shipment packaging to final delivery can prove disastrous for profits, service levels, customer loyalty, and other key metrics. With the global e-commerce market predicted to reach $8.1 That is the beauty of a platform enabled by AI.
That’s where data analytics comes in. By harnessing the power of data science and analytics, you can gain end-to-end visibility across your entire network, breaking down information silos and optimizing every stage of your operations. In this post, we’ll explore how data analytics can revolutionize your supply chain.
We consistently see that companies focused on functional excellence–a focus within a functional silo like manufacturing, transportation or distribution– or singular metrics– like inventory or costs– underperform against their peer groups. Reward teams for cross-functional metrics. Maturity in Analytics.
We cannot change things overnight, but there are some steps that we can take through the use of advanced analytics. Invest in analytics to sense and translate demand. Change internal metrics to a balanced scorecard and force the functions to work better together. Build capabilities to manage planning master data. What to do?
We cannot change things overnight, but there are some steps that we can take through the use of advanced analytics. Invest in analytics to sense and translate demand. Change internal metrics to a balanced scorecard and force the functions to work better together. Build capabilities to manage planning master data. What to do?
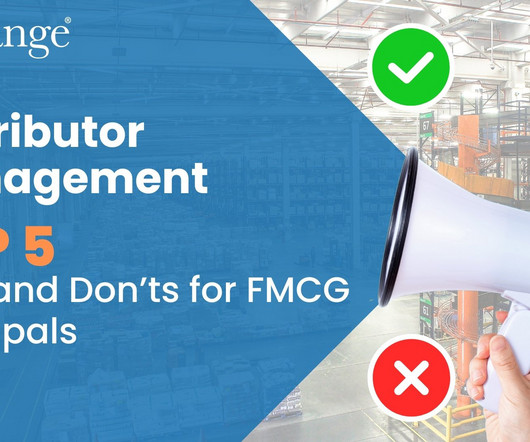
Do Set Clear KPIs and Governance Structures : Establish transparent metrics for sales, coverage, and service levels. Do Invest in Distributor Capability Building : Provide training, digital tools, and performance incentives. A well-equipped distributor is an extension of your brand and a key to market penetration.
Resist the temptation to place deeper analytics on top of existing data models. Out of desperation, they turned to the use of descriptive analytics. The focus of the transportation suites was on cost mitigation and price negotiation. Watermelon Metrics Don’t Drive The Right Results. What are functional metrics?
Supply chain efficiency is the cornerstone of success and involves the effective management of processes, resources, and technologies from procurement to production, transportation to warehousing. Transportation and Logistics: The goal here is to minimize delivery costs while maintaining reliable service levels.
The advent of transportation management systems (TMS) in the 1990s introduced near-infinite metrics and data points into the supply chain yet brought with it more questions than answers: How do we centralize the data? The Fundamentals of Managed Analytics. How well is my transportation routing guide performance?
OTR freight represents a long-standing aspect of supply chain operations and transportation management. M odern transportation networks and supply chains continuously adapt to market volatility and transitions. Download the White Paper: Over the Road Freight Management Trends.
Ipsen faced transportation capacity constraints, complications at country borders, and even temporary shutdowns at their own plants. And the linked nature of supply chains mean that collaboration is necessary to ensure that a solution to a problem doesn’t meet the metrics for one link but negatively impact another.
There are three reasons why: Vertical excellence—having the best manufacturing, procurement or transportation function—has not worked. The use of channel data into advanced analytics to sense demand. Aligned Metrics. However, it requires the use of retail data and the redesign of analytics to sense, shape and translate demand.
For logistics professionals, this translates to smarter warehouse layouts, more accurate transportation planning, proactive maintenance scheduling, and a new level of resilience through cost-to-serve optimization. This article explores how digital twins are being deployed in transportation, warehousing, and network design.
Developing Analytical Skills Data analysis is at the heart of effective supply chain management. MTSS platforms support the development of these analytical skills by integrating advanced tools and resources that allow learners to engage with real-world data sets.
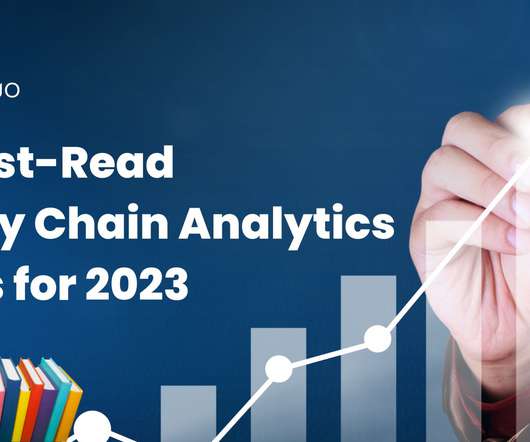
If you want to gain more supply chain analytics knowledge, you’re in the right place. We’ve compiled a list of 10 great supply chain analytics books to help you better understand the concepts and strategies behind this vital business field.
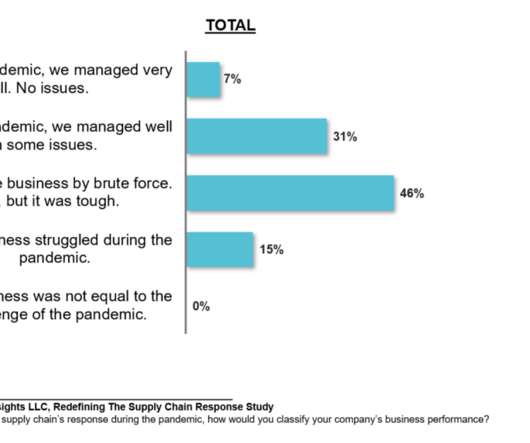
Yes, we have achieved greater normalcy in transportation. For organizations layered in functional metrics and driving a cost agenda, this is a tough nut to crack. In the survey, 48% of companies were driving digital transformation, but the only element that improved performance was descriptive analytics. What is normalcy?
Some supply chain companies are leaning on the power of analytics to help streamline their processes and get ahead of their competitors. But many companies have struggled to embrace the relationship between using analytics and implementing changes that can improve business performance. But the benefits far outweigh the challenges.
Closing the gaps happens when there are aligned metrics, clarity of vision and aligned planning processes. Applications that operate in this horizon are manufacturing or production planning, demand sensing, Vendor Managed Inventory (VMI), Supplier Managed Inventory (SMI), and Transportation Management Systems (TMS). They lack cohesion.
Procuring transportation for freight is much different than any other procurement category. Transportation procurement needs to support both customer service and a company’s internal supply chain goals. A 95% on time delivery metric – very high performance – is just not good enough for Simmons. Speed is of the essence.
This company leverages AI and automation across multiple layers of its supply chain, including forecasting, replenishment, and transportation logistics. Optimize Transportation Routes : AI-powered analytics suggest alternative delivery routes to minimize delays and reduce costs.
Editor's Note: Today's blog is from our friend Derrick Rehn with FusionOps who shows us how big data analytics can benefit you in your supply chain. . As big data analytics offer a sizeable competitive advantage for many industries, the drive to deliver cutting edge innovation in data analytics is ever increasing.
Transportation management systems ( TMSs ) are not a new concept, but where they are hosted now, in the cloud, is still new to the shipping industry. Cloud-Computing Uses Real-Time Data to Process Analytics and Provide Superior Insight. The cloud offers unique benefits to shippers, vendors, customers and logistics providers.
While there are many types of visibility (see Figure 1), the most common use case is either sourcing or transportation visibility. What most companies want is a system with prescriptive analytics to tell them when a shipment is expected to be late and what action to take. Visibility. Gaps in Enterprise Visibility. 2) Latency.
While supply chain software companies offer solutions that come with analytic solutions, the data used for the analytics is usually archived data. But this conference was focused on a near real-time analytics solution they developed called Rebus. Here “near real-time” is defined as a refresh of key metrics every five minutes.
OTIF is a key supply chain metric. Andrew Lynch is President and co-founder of Zipline Logistics , an award-winning North American 3PL that specializes exclusively in the transportation of retail consumer goods. It is generally calculated as a percentage of total deliveries that were complete and on time. About Andrew Lynch.
Through the use of connected devices and greater abilities to capture data in real time, the concept of end-to-end visibility and improvement thru the use of supply chain analytics has changed. What Do Supply Chain Analytics Have to Do With This Ability? What About the Driver Shortage and Transportation Rate Hike?
Make, source, and deliver need to be managed together based on analytics that sense and respond at the speed of business. We find that three factors mattered: organizational alignment, descriptive analytics, and inventory management. Decrease the focus on functional metrics and align to a balanced scorecard. Conclusion.
Data-Driven Decision Making : Using analytics to continuously refine operations. Leverage Data Analytics for Demand Forecasting Advanced analytics tools can predict customer demand and help you optimize inventory. Sorting systems Automated transportation with automated guided vehicles.
We organize all of the trending information in your field so you don't have to. Join 102,000+ users and stay up to date on the latest articles your peers are reading.
You know about us, now we want to get to know you!
Let's personalize your content
Let's get even more personalized
We recognize your account from another site in our network, please click 'Send Email' below to continue with verifying your account and setting a password.


Let's personalize your content