This site uses cookies to improve your experience. To help us insure we adhere to various privacy regulations, please select your country/region of residence. If you do not select a country, we will assume you are from the United States. Select your Cookie Settings or view our Privacy Policy and Terms of Use.
Cookie Settings
Cookies and similar technologies are used on this website for proper function of the website, for tracking performance analytics and for marketing purposes. We and some of our third-party providers may use cookie data for various purposes. Please review the cookie settings below and choose your preference.
Used for the proper function of the website
Used for monitoring website traffic and interactions
Cookie Settings
Cookies and similar technologies are used on this website for proper function of the website, for tracking performance analytics and for marketing purposes. We and some of our third-party providers may use cookie data for various purposes. Please review the cookie settings below and choose your preference.
Strictly Necessary: Used for the proper function of the website
Performance/Analytics: Used for monitoring website traffic and interactions
The bigdata architectures are often present in the current “AI offerings.” The use of python and big-data architectures enables the ingestion of unstructured and streaming data that can move the model from inside-out (using enterprise data) to outside-in (use of market data).
In follow-up qualitative interviews, one of the largest issues with organizational alignment was metric definition and a clear definition of supply chain excellence. In my post Mea Culpa, I reference my work with the Gartner Supply Chain Hierarchy of Metrics. Error is error, but is it the most important metric? My answer is no.
Companies across the globe have taken note of the value of bigdata analytics in logistics and how tracking key performance indicators (KPIs) and core metrics can dramatically affect supply chain performance. The post 5 More Reverse Logistics Metrics to Track appeared first on Transportation Management Company | Cerasis.
According to a July 2014 supply chain research study from Accenture focused on BigData and supply chain risk management, most organizations have high hopes for using bigdata analytics in their supply chain but many have had challenges in deploying it. You can start small with a few trading partners and expand over time.
Drip BigData. The issue is that when companies optimize functional metrics, they throw the supply chain out of balance and sub-optimize value. Industry 4.0. The Connected Supply Chain. Drip Digital Supply Chain. Autonomous Supply Chain Planning. Self-Healing Supply Chains. Touchless Supply Chains.
The consulting team pitches a theme–vision of supply chain best practices, bigdata analytics, or demand-driven value networks– to the executive team, and a new project is initiated. In addition, I am now done with the page proofs for my new book, Metrics that Matter. The book is a story. We hope to see you there!
Editor's Note: Today's blog is from our friend Derrick Rehn with FusionOps who shows us how bigdata analytics can benefit you in your supply chain. . As bigdata analytics offer a sizeable competitive advantage for many industries, the drive to deliver cutting edge innovation in data analytics is ever increasing.
Form and socialize your own hierarchy of metrics. Here is the metrics framework that I am using at present in my outside-in classes. For example, don’t focus on forecast error. Instead, analyze demand flow characteristics by demand stream to evaluate Forecast Value Added (FVA), forecastability, and bullwhip impact.
It’s no longer considered magic because we now have advanced analytics systems that harness and organize massive amounts of disparate data and model that bigdata in ways that allow humans to be proactive and make informed decisions. How can bigdata lead to supply chain optimization?
If you miss reading the Shaman in the next few weeks and you want some new reading in the area of supply chain excellence, consider tucking my new book Metrics that Matter into your suitcase. Enjoy the holidays. Today, it is rolling off the presses, as I write, and it will ship from the Amazon warehouses on December 15th.
“There is irony behind a discussion of the business value and metrics related to bigdata analytics, since a lot … Continued. The post BigData Analytics Can Help Improve the Bottom Line appeared first on Enterra Solutions.
Closing the gaps happens when there are aligned metrics, clarity of vision and aligned planning processes. Metrics Alignment. As a result, they never look at metrics in isolation of each other, and try to build the overall potential of the system focusing on alignment and balance. They lack cohesion. I hope that this helps.
I think about this discussion with Keith often as I work on the Supply Chain Index and edit the chapters of Metrics That Matter. We are currently doing research on the evolution of new forms of analytics in the hype cycle that many people refer to as BigData , and we are completing our survey on digital manufacturing.
Is enthusiasm for BigData wavering? They also predicted that 80 to 100% of manufacturers will have implemented IIoT applications by then and already be reaping the benefits of data-driven insights into their operations. In this post, I’ll cover the three ways you can use BigData to improve operational performance. #1
Supply chain leaders are enthralled with the idea of using bigdata, but they tend to fail to understand how to disseminate bigdata in their organization properly. Ask Traditional Questions, and Let BigData Provide Answers. However, the fundamental problem remains. Increasing order efficiency.
Supply chain centers of excellence help with metrics alignment, and product portfolio alignment, between finance and the supply chain team, and the supply chain team and marketing. Next week, I will be writing on my new book Metrics That Matter. The issues abound, but we cannot let the problems with execution blind us.
A shift from functional metrics to a balanced scorecard. I like the use of growth, margin, inventory turns, Return on Invested Capital, customer service and ESG metrics. The focus on functional metrics sub-optimizes balance sheet results. Funny, isn’t it?
Most S&OP efforts break down due to disconnected systems, siloed data, and a lack of cross-functional engagement. According to Gartner , early stages of S&OP maturity often lack formal processes, metrics, and cross-functional participation. This transparency improves confidence and accountability across the business.
To survive in an increasingly complex, data-driven world, businesses must be ready to implement new “BigData” solutions to ensure all data is aggregated, analyzed, and stored appropriately. Businesses are often left with questions about the origination of such data.
In part one I laid out the 5 stage maturity model that shows how organizations can turn their “bigdata” into “big visibility” The stages are 1) Representation; 2) Accessibility; 3) Intelligence; 4) Decision Management; 5) Outcome-Based Metrics and Performance. The Network Effect'
For smaller businesses just starting out, they may not have adequate resources to capture this information — and managers may not know what metrics to look out for. In this article, we explore what bigdata is and its benefits for small businesses, from tracking sales trends to keeping an eye on competitors. What is bigdata?
We started with mining the data on supply chain financial ratios within industry groups. This research was the backbone of the Supply Chain Metrics that Matter series of reports. Instead, they have measured functional metrics or focused on projects. The Building of the Index. As we did this analysis, I was amazed.
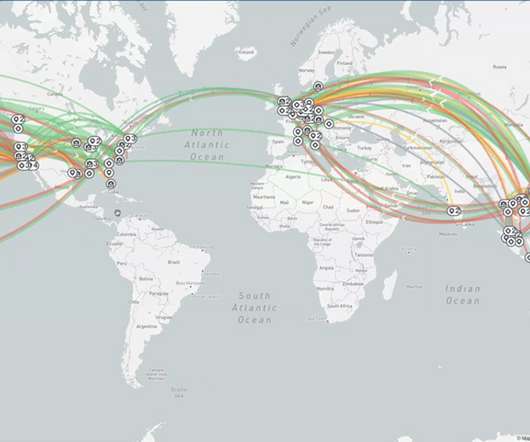
If the arrow is red, the industry is moving backwards on a metric. While we agree that each of these companies are leaders with significant contributions to the industry, we do not find these companies outperforming when compared against their peer groups on a balanced portfolio of metrics. If the arrow is green, progress was made.
Today, organizations are increasingly empowering teams to harness the potential of AI, bigdata, and analytics to optimize daily operations and enable data-driven decision-making. interviews) with quantitative metrics (e.g., Artificial intelligence is revolutionizing supply chain operations at an unprecedented pace.
I have learned that supply chain systems are more complex than I originally thought, and that the relationships between supply chain metrics are nonlinear. I have also learned that you need a large data pool to derive the type of analysis that I want to publish. It takes more than one or two respondents from a company.
Reports, dashboarding tools, key performance indicators and metrics, created and analyzed via bigdata and analytics, can help managers stay aligned with enterprise-wide and customer needs, fulfill more orders, and avoid disruptions or repercussions from violations of regulatory measures.
Last mile delays and problems during delivery can eat away at fuel costs and seriously devalue a brand, but shippers Fan leverage technology, such as BigData, to make small changes and improvements to last mile logistics processes. Be Consumer-Centric. An effective last mile logistics strategy must be focused on consumer needs.
Figure 1: Demystifying Data Units. Embracing bigdata brings the promise of reduced costs, improved customer service, reduced risk and the ability to capture new opportunities. However, capturing the data you need is just the start of the journey. Figure 2: Results Achieved Using BigData Analytics.
As an in-memory solution, Nexus allows for BigData to be accessed very quickly. The Nexus model can also provide the kind of data that digital twins that are based on a static planning model struggle to provide true lead times (and other supply chain throughput/cycle time metrics).
It is hard work to maintain the status quo in metrics performance. A balanced portfolio of metrics delivers the greatest value. Companies balance supply chain metrics better in good times than bad. Reader’s note, the way to reach this chart is to first identify the average value for the metric for the period of 2010-2016.
Bigdata is used to understand a customer’s propensity to buy, the tendency to return, conversion of clicks to orders, demand sensing signals, individualized promotions, etc. to provide very specific output (production, fulfillment, transportation plans by product/date, etc.).
Download: The Impact of BigData in the Supply Chain & Transportation Management Industry Webinar Replay, Transcript & Presentation. Omnichannel Supply Chain Metrics: What Should Supply Chain Leaders Measure? Share This: Read More. Share This: Read More. Share This: Read More.
I now have a working manuscript for the entire book of Metrics That Matter. In preparation, we are finishing up research on supply chain planning excellence, bigdata and supply chain, supply chain talent, and digital manufacturing. BigData Supply Chains. It appears SO barren from my window in seat 4D.
“Trust can be built through a closed-loop change management effort that is centered on performance metrics that accurately reflect the current state of the supply chain system.” Once these metrics are in place, it is easy to gauge the results against past processes. writes Melissa R. Bowers, Adam G. Petrie, and Mary C.
Confused on which metrics matter and which industries have made the most progress over the course of the last decade? These include the lack of supply chain talent, the emerging opportunities with BigData and new forms of analytics, and the evolution of Corporate Social Responsibility programs.
Warehouse Metrics to Track to Improve Profitability and Operations : Today’s warehouse managers often accrue massive amounts of performance data, but sometimes find they can apply little of it toward making productivity gains or customer service improvements. Download the Webinar Replay. Read the Full Post. Read the Full Post.
Shippers, carriers, freight forwarders and third party logistic firms are currently spending millions of dollars in resources on ‘estimating’ important metrics such as container Estimated Time of Arrival (ETAs). And relative to emerging data sources of relevant BigData on global supply chains, one very interesting new player is Spire Global.
We speak about the need to move from a functional understanding to a global, holistic capabilities, but the traditional supply chain leader defines bonus incentives and process performance goals based on functional metrics. Measurement. Organizations speak of the bullwhip, but don’t measure it or monitor the effects.
It was also evident that many folks wanted more information around KPIs and Metrics, as our top 5 included two posts from this sub-category. e-Book] The Ultimate Guide to Manufacturing, Supply Chain, Logistics, Transportation, & Freight Metrics & KPIs. Businesses are often left with questions about the origination of such data.
The emergence of cloud-based platforms and BigData increases forecast accuracy, eliminates unnecessary stock, and achieves truly optimized slotting designs. BigData can analyze picking performance and identify best practices to increase performance, effectively reducing the amount of on-hand inventory needed at any given time.
BigData Accessibility Will Drive Innovation and Change. Take a moment to think about BigData. It is a combination of numbers, statistics, progress reports and real-time data. You cannot realistically review every detail manually, so how BigData is accessed and distributed will also change in 2017.
Over the course of the last quarter, with the help from Cloudera, we built a data lake of with data from 1449 public companies. We loaded 493 financial metrics from balance sheets and income statements for each company into the data lake for the period of 2004-2016 using YCharts data.
However, that blind spot is going away, thanks to advancements in technology (such as mobile devices, geolocation technologies, connected carrier networks, and bigdata) and significantly lower costs to deploy them. There are multiple sub-metrics that go into OTIF, but real-time freight visibility is definitely a component of it.”.
One of my favorite interviews on this topic, that I recently completed for my upcoming book Metrics That Matter , was with Amway’s Chief Supply Chain Officer George Calvert. Service level is our most important metric. Reliability in both of these metrics is critical. Our activities are broad.
We organize all of the trending information in your field so you don't have to. Join 102,000+ users and stay up to date on the latest articles your peers are reading.
You know about us, now we want to get to know you!
Let's personalize your content
Let's get even more personalized
We recognize your account from another site in our network, please click 'Send Email' below to continue with verifying your account and setting a password.


Let's personalize your content