This site uses cookies to improve your experience. To help us insure we adhere to various privacy regulations, please select your country/region of residence. If you do not select a country, we will assume you are from the United States. Select your Cookie Settings or view our Privacy Policy and Terms of Use.
Cookie Settings
Cookies and similar technologies are used on this website for proper function of the website, for tracking performance analytics and for marketing purposes. We and some of our third-party providers may use cookie data for various purposes. Please review the cookie settings below and choose your preference.
Used for the proper function of the website
Used for monitoring website traffic and interactions
Cookie Settings
Cookies and similar technologies are used on this website for proper function of the website, for tracking performance analytics and for marketing purposes. We and some of our third-party providers may use cookie data for various purposes. Please review the cookie settings below and choose your preference.
Strictly Necessary: Used for the proper function of the website
Performance/Analytics: Used for monitoring website traffic and interactions
Unlike transporting goods across state lines, cross-border shipping demands specialized expertise, robust infrastructure and comprehensive security measures. Infrastructure for efficient freight movement The physical infrastructure supporting cross-border shipping forms the backbone of efficient operations. Mexico trade.
Core Activities in Logistics: Order fulfillment Warehouse and inventory management Freight and shipping coordination Packaging and labeling Last-mile delivery and returns Goal: Efficient and cost-effective movement and storage of goods. It includes managing trucks, ships, planes, trains, and the infrastructure and data that support them.
metric tons of CO2 equivalent per million USD in revenue, down 58% from FY09 levels, despite daily package volumes rising by an average of 121%. FedEx says that since 2005, aviation emissions intensity (the amount of emissions per unit of activity) has dropped 31% and the company is aiming for a 40% reduction by 2034.
Supply chain design looks very different by company. Today, three out of four companies greater than 10B$ have a networkdesign group that averages seven people. So, how do companies get good at supply chain design? It is about changing traditional paradigms and building the processes to make design a priority.
Based on the work with Georgia Tech, we are getting clear on which metrics matter by industry. As companies adopt a balanced scorecard, the functional metrics shift to a focus on reliability. They implemented a simple planning technology with an outside-in channel-centric model (Ship to model definition).
The warehouse I ran just completed a consolidation of three shipping centers. The analysis, based on network optimization assumed average loading, and did not account for the swings. So, I was always struggling on a daily basis to establish a feasible plan to ship 180 trucks out of 22 doors in a twenty-four-hour operation.
As consumer spending fell, the days of escalating ocean freight and extreme shipping variability eased this year. For organizations layered in functional metrics and driving a cost agenda, this is a tough nut to crack. The ride is uphill, but the visibility is low. What is normalcy? However, variability and global unrest is rising.
A networkdesign model figures out where factories and warehouses should be located. The key solutions are demand forecasting/inventory optimization, supply planning, and networkdesign. The key solution for this is networkdesign. Supply and networkdesign models are constraint-based models.
This week, I will speak at Llamasoft’s conference on improving supply chain networkdesign. While innovation has slowed in Enterprise Resource Plannning (ERP) and Supply Chain Planning, I am bullish about some of the innovation coming from the supply chain networkdesign technology providers like JDA, Llamasoft and Solvoyo.
Maersk, the world’s largest container shipping company, reported its best quarter in 117 years, posting a $5.9B Ships continue to hold in the west coast harbors of LA and Long Beach, and the west coast warehouses are full. Much of the inventory on the ships at sea will miss the essential seasonal windows.
of in-stock products ship the same business day from our DCs; that is best of breed for any industry.” The goods flow through 2 import centers, 14 strategically located distribution centers in North America, 66 final mile shipping hubs, and nearly 1,700 branch locations. Products can be shipped to a work site or a place of business.
In dynamic slotting, goods for which there is high demand are located nearer to the shipping docks to minimize travel. It is better to receive inventory on a loading dock, take the inventory needed for a hot shot shipment, and move that inventory through the DC to a shipping dock where it is loaded on a truck.
Metrics such as lead-times, forecast accuracy, inventory levels, and service are used to measure operational risks. Design and planning software has been utilized for the last several decades to manage these operational risks. What is the cost impact of making changes?
Snow fell last night as I worked on my last Supply Chain Metrics That Matter report. The concept of the Effective Frontier is that best in class companies align functional metrics to balance growth, cost, inventory and Return on Invested Capital (ROIC) performance while balancing customer service metrics. The Effective Frontier.
For example, in 2011 Amazon initiated a program called Amazon Prime (free 2-day shipping and discounted 1-day shipping). 2) Customize Logistics Network. So, logistics networkdesign is a kind of initiative driven mainly by customer. 7) Adopt Both Service and Financial Metrics.
In the survey, APQC used a series of performance metrics, including net promoter score, customer retention rate, perfect order performance, and on-time delivery among others, to identify the top performing companies. Below are the results from the cross-industry report for environmental sustainability.
Granular data by volume is a must to be able to manage replenishment, networkdesign, and inventory targets. No metric should be measured in isolation, and functional metrics should be replaced with the balanced scorecard metrics shown in Figure 2. The issues include: Level of granularity. Time horizon.
The increasing need for constantly analyzing these trade-offs across the supply chain networks has highlighted the need for digital twins and what-if capabilities in networkdesign solutions. Shipping items back and forth creates needless greenhouse gas emissions, and only 54% of all packaging gets recycled.
Maersk, the world’s largest container shipping company, reported its best quarter in 117 years, posting a $5.9B Ships continue to hold in the west coast harbors of LA and Long Beach, and the west coast warehouses are full. Much of the inventory on the ships at sea will miss the essential seasonal windows.
Maersk, the world’s largest container shipping company, reported its best quarter in 117 years, posting a $5.9B Ships continue to hold in the west coast harbors of LA and Long Beach, and the west coast warehouses are full. Much of the inventory on the ships at sea will miss the essential seasonal windows.
Containers wait at each ship node for the chassis. Change internal metrics to a balanced scorecard and force the functions to work better together. The design, and redesign, of supply chains needs to be continuous based on market data. Invest in networkdesign technologies. Volume is up. What to do? What to do?
Containers wait at each ship node for the chassis. Change internal metrics to a balanced scorecard and force the functions to work better together. The design, and redesign, of supply chains needs to be continuous based on market data. Invest in networkdesign technologies. Volume is up. What to do? What to do?
Q: What is the best metric to begin analyzing when starting to evaluate Supply Chain agility? Q: You touched on robust networkdesign tools which allow you to test your network to determine your agility. I continue to be impressed with the work that Llamasoft is doing on simulation and optimization in networkdesign.
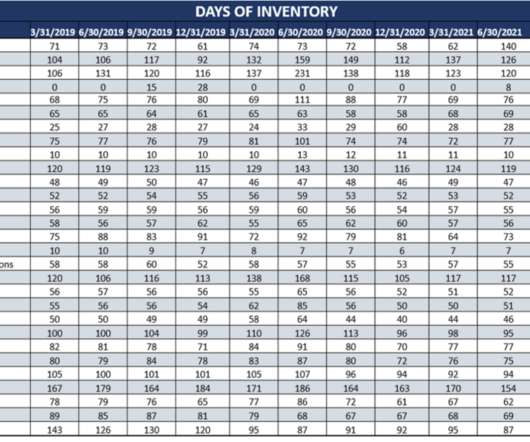
Most companies cannot get to data by customer on orders shipped incomplete to understand root cause analysis. In Figure 1, we show the aggregate trend of the chemical industry in an orbit chart format showing year-over-year results at the intersection of two metrics operating margin and inventory turns. Let’s take an example.
The use of customer segmentation strategies to define order policies for lead times, discounts, allocation, and shipping priorities. These Supply Chain Operating Network Strategies enable multi-tier many-to-many enablement of first and second/third tiers of suppliers of services, materials and transportation. Buffer Design.
Focus on traditional metrics. Driving Singular Metrics strategies. Strong planning and networkdesign. The recommended best practice involves designing carrier performance scorecards (as one example) focusing on the aggregate performance of carriers in any given lane. Focus on Horizontal Processes.
NetworkDesign and Market Strategy – This is where you’re making those crucial decisions about where to place warehouses, which markets to serve, and how to structure your distribution network. Every purchase order, shipping notification, and delivery confirmation needs to flow seamlessly between partners.
Many metrics can be used to determine the top 3PL warehousing companies, such as company revenue, the number of warehouses, total warehouse square footage , etc. This compilation is based on the most currently available company revenue data (between 2018 and 2020) without factoring in any other metric. Revenue: JP¥ 1,829 billion/ $16.5
To give you an idea of what this is doing, the classic retail metrics, “same store sales” and “sales per square foot”, are no longer being reported by Macy’s department stores. The store is a node in the network. Sales people like to be working with customers, not shipping stuff in boxes.
Machine learning excels at visual pattern recognition, opening up many potential applications in physical inspection and maintenance of physical assets across an entire supply chain network. The machine learning algorithms in IBM’s Watson platform were able to determine if a shipping container and.or
Core Activities in Logistics: Order fulfillment Warehouse and inventory management Freight and shipping coordination Packaging and labeling Last-mile delivery and returns Goal: Efficient and cost-effective movement and storage of goods. It includes managing trucks, ships, planes, trains, and the infrastructure and data that support them.
billion metric tons—the emissions have rebounded in 2021 and 2022. The latter was so severe that cargo ships had to run at half their usual capacity. Network optimization. These are challenges that will only become more threatening if they are not curbed, paying strict attention to supply chain sustainability. Green packaging.
It’s not unusual for example, for companies to measure their supply chain performance only on the basis of financial metrics like supply chain cost per order. Distribution NetworkDesign Correcting poor networkdesign is one of those supply chain basics to which there might not be a simple solution.
It’s not unusual for example, for companies to measure their supply chain performance only on the basis of financial metrics like supply chain cost per order. Distribution NetworkDesign. Correcting poor networkdesign is one of those supply chain basics to which there might not be a simple solution.
In the context of supply chain management, prescriptive analytics leverages raw historical data and performance data to determine the best probable courses of action, supporting supply chain decisions through networkdesign, inventory and warehouse optimization, and supplier management.
It also considers leading indicators that provide clues as to what customers are planning to ship, interesting correlations that have been developed, and hypotheses and their implications for internal capital investment and capacity planning.
Today, businesses are at the cusp of new changes in the supply chain that includes evolving customer expectations, omnichannel purchasing, and the shipping of unpredictable volumes. A well-planned delivery network is the foundation to the success of logistics operations, which is possible through supply chain networkdesign.
Therefore, better networkdesign, planning and operations are all needed, and all of which might not be completely satisfactory. For example, a certain product is ready to be shipped from the manufacturing facility. These changing buyer habits then require complete cohesivity within your organization.
I want to understand why some companies outperform on the Supply Chain Metrics That Matter while others do not. The conversation focused on P&G’s slow response to adapt to smaller units and flexible shipping policies. Price and shipping policies should go hand in hand. I am on a mission. Pay for Performance.
A carbon emissions reduction strategy must take all Suppliers into account, not just the impact from your in-house facilities. Further your Supplier selection and management plan must include reporting on environmental emission metrics along with reduction goals and performance tracking. Reverse Logistics/Repair Operations.
Today, there are forty-five large ships off of the port of Long Beach. Evaluate networkdesign options to simplify sourcing and reduce the number of platforms. Substitute corporate dashboard metrics like margin, customer service, growth, and inventory health for functional metrics like OEE and Purchase Price Variance.
My first Monday in, I asked for a full report of all our supply chain metrics, and my analyst told me he could get it to me by Friday. You can either ship it by boat from China (30 days) or by plane (FedEx). It has long distances between nodes, lots of back and forth between locations, and appears to be entirely random in design.
Staff unavailability, material and component shortages, roadblocks, bottlenecks in transportation and high shipping costs, all contributed to this situation. A recent example of this is the Suez Canal blockage , when a container ship was wedged in the canal, bringing freight movement to a halt and leading to delays in deliveries.
Shipping Standards. As companies mature, networkdesign activities using customer data becomes a monthly process. Lora wrote the books Supply Chain Metrics That Matter and Bricks Matter , and is currently working on her third book, Leadership Matters. What do I mean? Don’t use customer data blindly.
We organize all of the trending information in your field so you don't have to. Join 102,000+ users and stay up to date on the latest articles your peers are reading.
You know about us, now we want to get to know you!
Let's personalize your content
Let's get even more personalized
We recognize your account from another site in our network, please click 'Send Email' below to continue with verifying your account and setting a password.


Let's personalize your content