article thumbnail

Provoking the Industry to Move Past Incrementalism

Supply Chain Shaman

When we study 600 public companies by peer group, at the intersection of inventory turns and operating margin, only 5% drive improvement. To make the argument, let’s look at industry orbit charts in aggregate for the period of 2006-2017 for the apparel and chemical companies. of revenue on IT are we improving inventories.

article thumbnail

SanDisk’s Story of Customer Segmentation Strategies Using Inventory Postponement

Supply Chain Shaman

Instead, in the SanDisk journey , they adjusted the speed of response to their customer segments, and actively designing inventory postponement strategies. Orbit Chart for SanDisk for 2006-2014. This included monthly reviews between business units and central operations teams and adaptive inventory segmentation policies.

Insiders

Sign Up for our Newsletter

This site is protected by reCAPTCHA and the Google Privacy Policy and Terms of Service apply.

article thumbnail

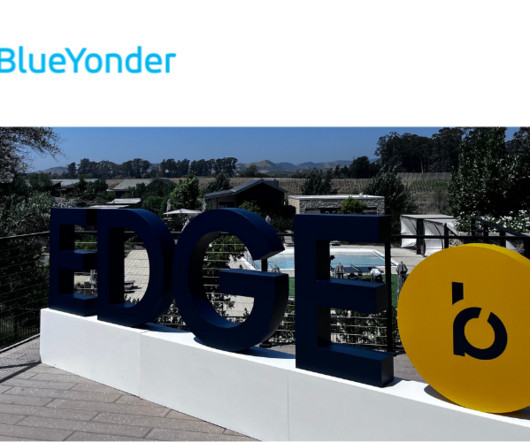
AI in Commerce: Takeaways from The Edge Summit

BlueYonder

The speakers and the attendees all likened this moment in AI adoption to other key moments in time – it’s 1997 and the internet is gaining traction, its 2006 and the smartphone is revealing its power, and, now, it’s 2023 and the curtain is going up on Act 1 of the generative AI play.

article thumbnail

L’Oréal: A Case Study in Supply Chain Excellence

Supply Chain Shaman

The award, based on beating the industry peer group on rate of improvement on the key metrics of growth, operating margin, inventory turns, and Return on Invested Capital (ROIC) while outperforming their peer group, is tough to achieve. Orbit Chart for L’Oréal at the Intersection of Inventory Turns and Operating Margin.

article thumbnail

Why Financial Reengineering Does Not Equal Supply Chain Improvement

Supply Chain Shaman

The concept of the Effective Frontier is that best in class companies align functional metrics to balance growth, cost, inventory and Return on Invested Capital (ROIC) performance while balancing customer service metrics. The cash-to-cash definition is: Cash-to-cash= Days of Receivables+ Days of Inventory-Days of Payables.

article thumbnail

Talent Trap

Supply Chain Shaman

In short, they have been able to drive improvements in one or two metrics; but, they are struggling to improve a portfolio of metrics that includes customer service, cost, inventory turns, and growth. In 2006, I asked Dick why it was taking him so long to define the roles of planning within P&G. What does that mean?

article thumbnail

Let the Qs Begin

Supply Chain Shaman

While the performance rankings were based on comparisons of inventory turns, operating margin and Return on Invested Capital (ROIC) for the periods of 2006-2013 and 2009-2013, the concept is that to be a supply chain leader you must outperform and drive improvement. We find that this is true of too few companies. Supply Chain Design.