Remove 2007 Remove Industry Remove Metrics Remove Procurement
article thumbnail

Supply Chain Performance Declined In the Last Decade. The Question is Why?

Supply Chain Shaman

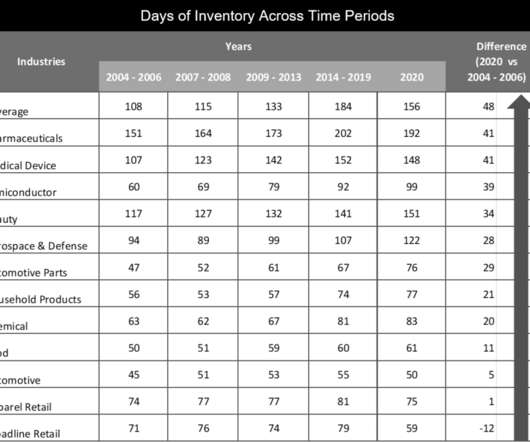
Yes, companies held more inventory (measured in days of inventory) in 2019 than at the start of the 2007 recession. Commercial and operating teams in manufacturing organizations greater than 5B$ in annual revenue were more aligned in 2007, at the beginning of the recession, than in 2020, the start of the pandemic. Alignment Barriers.

article thumbnail

REPOST: The True Cost of OTIF Failure with Andrew Lynch

The Logistics of Logistics

OTIF is a key supply chain metric. Lynch and his team leverage data intelligence and strong industry relationships to help clients uncover transportation savings, build scalable supply chain strategies, and ace retailer compliance programs. The minimum OTIF percentage varies by industry. About Andrew Lynch. third-party?logistics.

Insiders

Sign Up for our Newsletter

This site is protected by reCAPTCHA and the Google Privacy Policy and Terms of Service apply.

article thumbnail

The True Cost of OTIF Failure with Andrew Lynch

The Logistics of Logistics

OTIF is a key supply chain metric. Lynch and his team leverage data intelligence and strong industry relationships to help clients uncover transportation savings, build scalable supply chain strategies, and ace retailer compliance programs. The minimum OTIF percentage varies by industry. About Andrew Lynch. third-party?logistics.

article thumbnail

How We Stubbed Our Toe in The Evolution of S&OP

Supply Chain Shaman

Industries carried on average 32 days more inventory in 2020 than in 2007. (I Organizations can align to drive value despite the allegiance to functional metrics. The industry considers the company a leader, but I know the dark side that internally, the IT processes squash innovation. Mistake #5. Measurement.

S&OP 195
article thumbnail

Collaboration? When It Comes to Cash-to-Cash, We Don’t Know How to Walk the Talk

Supply Chain Shaman

Cash-to-Cash Metrics. Cash-to-cash is a compound metric: (Days of Receivables+Days of Inventory)-Days of Payables=Cash Conversion Cycle. The impact of the elongation of payables on receivables varies by industry, but on average across the industries increased eighteen days when comparing the past five years to the pre-recession years.

article thumbnail

2020 Requires Big Wings and Feet

Supply Chain Shaman

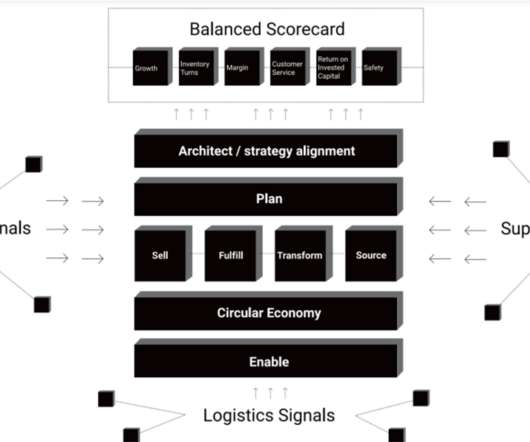
The number one question that I am asked today by manufacturers across all industries is “How can I improve customer service?” No metric should be measured in isolation, and functional metrics should be replaced with the balanced scorecard metrics shown in Figure 2. Background. The reason why? The answer is simple.

article thumbnail

My Take: E2open Buys Terra Technology

Supply Chain Shaman

In 2007-2014 Terra added inventory management, multi-tier demand sensing, transportation forecasting, and long-term forecasting. As shown in Figure 1, demand and supply volatility is the largest issue for the supply chain leader across industries. Traditionally E2open sold to the procurement organization. It is a new buyer.