article thumbnail

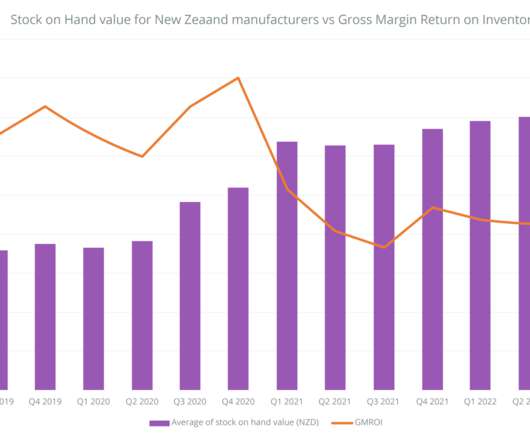
The Unleashed Manufacturing Health Index: Signs of Recovery as 2023 Closes

Unleashed

Faring worse than any other UK industry by a significant margin at 18, While in regions like New Zealand, the Food and Beverage industries have tended to index to one another, there’s been a fork in the road for UK food manufacturers and their beverage cousins. However quarter-on-quarter profitability for the sector is trending down.

article thumbnail

Inventory Management: We Can Do Better

Supply Chain Shaman

The period of 2007-2008 was the downturn of the recession while the period of 2009-2013 marked the recovery. Supply chain leaders in the beverage and household products industries struggled to manage complexity. The source of this data is a syndicated data provider of public reporting termed “Y-Charts.”). Complexity.

Insiders

Sign Up for our Newsletter

This site is protected by reCAPTCHA and the Google Privacy Policy and Terms of Service apply.

article thumbnail

New Bookends: The Tale of Supply Chain Global Leaders in Consumer Products

Supply Chain Shaman

In the selection of time frames to analyze, we look at the long-term view including the recessionary period of 2006-2009, the post recessionary period of 2009-2014 and the more recent time period of 2011-2014. In the last five years, consumer products and food/beverage leaders faced different challenges. How Have They Done?

article thumbnail

The Manufacturers Health Check: Firms Holding Double the Stock Amidst ‘Inventory Crisis’

Unleashed

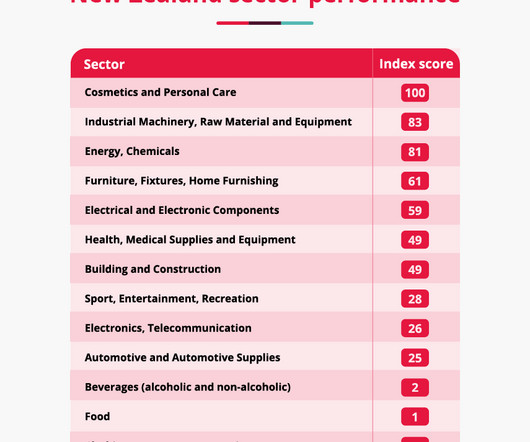
Energy, Chemicals 174.06% Sport, Entertainment, Recreation 123.14% Beverages (alcoholic and non-alcoholic) 115.18% Electronics, telecommunications, Electrical & Electronic components 89.94% Food 58.88% Clothing, Footwear, Accessories 56.71% Automotive and Automotive supplies 18.89% Building and construction -41.56%. Food 93.69%.

article thumbnail

How Big Food and Beverage Could Revolutionize the Natural Movement

Elementum

Those desires are echoed in recent sales numbers—Fortune recently reported that the top 25 food providers in the US lost a collective $18 billion market share since 2009, and the losses are increasing annually. Now, consumers are beginning to clamor for fewer ingredients—ones that are simple, natural, and more commonly, organic.

Food 60
article thumbnail

Measuring Up?

Supply Chain Shaman

The analysis is for two time periods: 2006-2015 and 2009-2015. Only beverage, pharmaceuticals and medical device companies have increased margins. As shown in Figure 2, apparel, mass merchants and beverage companies improved inventory turns. Resiliency. The study evaluates enterprise resiliency. Inventory Turns. Cash-to-Cash.

article thumbnail

My Lessons in Interviewing Supply Chains to Admire Award Winners

Supply Chain Shaman

Assa Abloy AB, Ametek, Broadcom, CCL Industries, Celanese, Clorox, Intuitive Surgical, Hubble, Lockheed Martin Corporation, Koninklijke Ahold Delhaize NV, Monster Beverages, Nike Inc., They used the work built together in 2004-2009 to build a course with Georgia Tech for executive training.) The winners include Apple, AbbVie Inc.,