Remove 2009 Remove Data Remove Food Remove Sourcing
article thumbnail

Technology Can Help Feed the World, Part 2

Enterra Insights

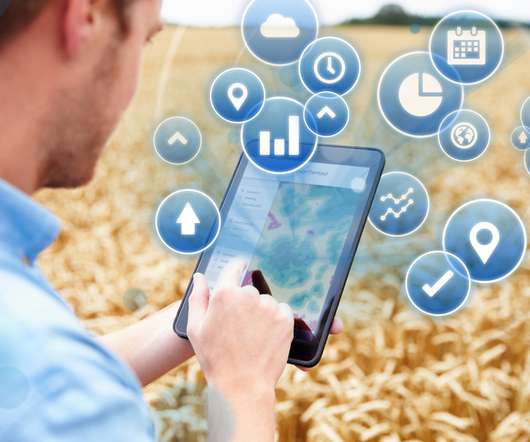
” Analysts from the Boston Consulting Group (BCG) add, “Over the past decade, public and private sources have dedicated impressive amounts of energy and resources to digital agriculture in developing countries.”[2] The significance of this lies in the growing need to produce more food while using less land for it.

article thumbnail

Offering Prayers While Looking Down the Barrel of a Gun

Supply Chain Shaman

This confession comes seven years after selling of contaminated food. The food recall is the largest in US history. In 2008-2009, nine died and hundreds became ill. …never before has a corporate executive been convicted of federal felony charges in a food safety violation. Food and Drug Administration and the U.S.

Insiders

Sign Up for our Newsletter

This site is protected by reCAPTCHA and the Google Privacy Policy and Terms of Service apply.

article thumbnail

Let the Qs Begin

Supply Chain Shaman

While the performance rankings were based on comparisons of inventory turns, operating margin and Return on Invested Capital (ROIC) for the periods of 2006-2013 and 2009-2013, the concept is that to be a supply chain leader you must outperform and drive improvement. Can you help us with what you see in the data?”

article thumbnail

Unwrapping the EU Packaging and Packaging Waste Directive: Embracing Sustainable Packaging in a Circular Economy

SupplyShift

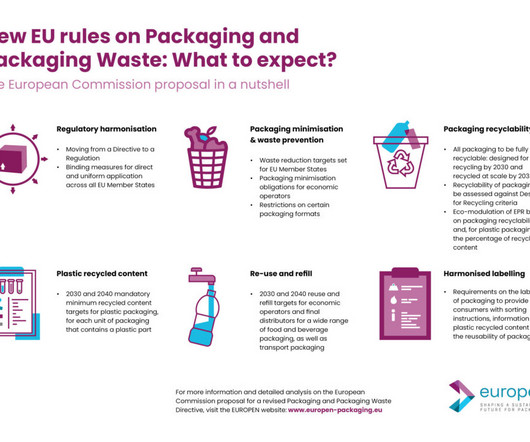
From 2009 to 2020, packaging waste in the EU increased by 20% , reaching 79 million tons in 2020. The setting of reuse and refill targets for various types of food and beverage packaging. Here, a data-driven approach is crucial. However, with the growth of the packaging market comes significant environmental repercussions.

article thumbnail

Transforming Consumer Value Chains: Navigating The Power Shift to the Shopper

Supply Chain Shaman

For December 2015, retail sales were the lowest since 2009. When we do these types of analysis, we look back at the data as far as we can reach (Y chart data is available only back to 2006 in a reliable form) and then we look at the period of 2006-2014 and the more recent period of 2011-2014. What does this mean? The difference?

article thumbnail

Coronavirus Increases Supply Chain Risk Management Priority

Enterra Insights

… When COVID-19 disrupted the delivery of essential goods such as food, pharmaceuticals, healthcare and even toilet paper, virtually everyone gave the supply chain more attention. During a pandemic the ability to shift to alternative sources could prove crucial. Supply chain vulnerability shouldn’t have been hard to spot.

article thumbnail

VMI Today

Logility

Source: Logility, Inc. We see the traditional data intensive VMI process merging with the best of Collaborative Planning, Forecasting and Replenishment (CPFR®). The data shows many companies are actively engaged in VMI with their suppliers and customers. Source: Logility, Inc. What is VMI?