This site uses cookies to improve your experience. To help us insure we adhere to various privacy regulations, please select your country/region of residence. If you do not select a country, we will assume you are from the United States. Select your Cookie Settings or view our Privacy Policy and Terms of Use.
Cookie Settings
Cookies and similar technologies are used on this website for proper function of the website, for tracking performance analytics and for marketing purposes. We and some of our third-party providers may use cookie data for various purposes. Please review the cookie settings below and choose your preference.
Used for the proper function of the website
Used for monitoring website traffic and interactions
Cookie Settings
Cookies and similar technologies are used on this website for proper function of the website, for tracking performance analytics and for marketing purposes. We and some of our third-party providers may use cookie data for various purposes. Please review the cookie settings below and choose your preference.
Strictly Necessary: Used for the proper function of the website
Performance/Analytics: Used for monitoring website traffic and interactions
Open Sky Group, a global leader in supply chain execution solutions, has announced a strategic partnership with Easy Metrics , a premier provider of labor management and warehouse performance management solutions.
In follow-up qualitative interviews, one of the largest issues with organizational alignment was metric definition and a clear definition of supply chain excellence. In my post Mea Culpa, I reference my work with the Gartner Supply Chain Hierarchy of Metrics. Error is error, but is it the most important metric? My answer is no.
For companies that want to go beyond the traditional spreadsheet, which cannot handle this ocean of information efficiently, statistical methods such as cluster analysis can help. What is Cluster Analysis? Cluster analysis is a statistical umbrella term for methods that classify data points according to their attributes.
Functional Metrics and the Lack of Alignment to Strategy. Few companies are clear on the number of supply chains they operate, design the rhythms and cycles of each, and align metrics to the strategy. The industry is not clear on desired outcomes. Clarity on Value. Guess what? It doesn’t. These two reports are coming soon.
Just by embedding analytics, application owners can charge 24% more for their product. How much value could you add? This framework explains how application enhancements can extend your product offerings. Brought to you by Logi Analytics.
Neil’s post in response to my post of Driving Value From Outside-in Planning : In her post, ‘Driving Value from Supply Chain Planning’, Lora Cecere provides great supply chain analysis and benchmarking for her supply chains to admire.
The research methodology for the Supply Chains to Admire compares the performance of a company against its industry peer group for the metrics of Year-over-Year Revenue Growth, Inventory Turns, Operating Margin, and Return on Capital Employed (ROCE). For 80% of industries, the supply chain metrics represent more than 40% impact on value.
billion rate data points monthly to provide the most comprehensive view of the market, helping you identify savings opportunities and make data-driven decisions. billion rate data points monthly to provide the most comprehensive view of the market, helping you identify savings opportunities and make data-driven decisions.
At each company, there is a relationship between the metrics of growth, margin, inventory, customer service, and asset strategy. For the purpose of this article, I will use Return on Invested Capital (ROIC) as the proxy metric to discuss asset utilization.) The analysis was too short-term. A potential value of a digital twin.).
Failure to effectively filter, prioritize, and analyze data can lead to “analysis paralysis,” where data volumes hinder timely decision-making. Implementing connected fleets requires a comprehensive cost-benefit analysis to assess how long-term savings and improved productivity align with these initial expenses.
He is responsible for driving strategy, customer engagement, and industry analysis. Shippers, brokers, carriers, news organizations and industry analysts rely on DAT for trends and data insights based on a database of $150 billion in annual market transactions. Prior to joining DAT, Adamo led the pricing and decision science teams at FedEx.
Enhanced Promotions and Events Analysis Promotions, advertising campaigns, and trade events are vital components of marketing strategy, but accurately measuring their impact on demand remains challenging. Five Ways Advanced Machine Learning in Demand Planning Is Improving Forecasting 1.
We consistently see that companies focused on functional excellence–a focus within a functional silo like manufacturing, transportation or distribution– or singular metrics– like inventory or costs– underperform against their peer groups. Reward teams for cross-functional metrics. Cost-to-Serve Analysis.
If you answer the survey, I will gladly give you a custom analysis of your organization against the peer group. In the supply chain team analysis, note the 21% gap between procurement and manufacturing teams, the 35% gap between sales and operations and the 21% gap between finance and operations. Functional Metrics.
A shift from functional metrics to a balanced scorecard. I like the use of growth, margin, inventory turns, Return on Invested Capital, customer service and ESG metrics. The focus on functional metrics sub-optimizes balance sheet results. Instead, focus on Forecast Value Added analysis. Funny, isn’t it? The reason?
Conduct Comprehensive Financial Analysis Demonstrate tangible ROI by highlighting: Projected revenue improvements Cost savings Return on investment metrics Performance during market volatility Real-world data shows probabilistic forecasting can improve forecast accuracy by 15-25% compared to traditional methods.
For my long-time readers, you know that fewer than 3% of companies outperform their peer group in our Supply Chains to Admire analysis , and that the Gartner Top 25 is essentially a beauty contest for underperformers. But, as the dust settles, is there value? And what is value? Supply chain leaders love bright and shiny objects.
My goal is to convince you to ground supply chain processes and technology implementations in data analysis while tying the results to the improvement in corporate performance. As a result, the need for measurement, data analysis and clear understanding of supply chain strategy increases. What do I mean by science? The So What?
KPIs: More Than Metrics – They’re Tools for Change was first posted on December 4, 2024 at 11:02 am. Learn how to design effective supply chain KPIs that drive organization change, align teams, and improve performance with actionable insights.
Need For What-If Analysis. Watermelon Metrics Don’t Drive The Right Results. I love the metaphor of watermelon metrics. In most organizations, there is a dashboard of functional metrics that shows all of the functions operating in the “Green” or acceptable levels until it comes to customer service.
Despite goals to improve agility and resiliency, functional metrics for manufacturing efficiency continually throw the supply chain out of balance. The analysis covers the period from 2010 to 2019. The analysis covers the period from 2010 to 2019. The analysis includes over 700 companies across 28 industry sectors.
For a more detailed analysis, check out the Power point summary.) I find in the orbit chart analysis that 45% of companies in the report are unconsciously incompetent. The group’s response is, “Are these supply chain metrics?” Today, we published The Supply Chains to Admire for 2023. be careful.
Over the last month, I have been working on the 2019 Supply Chains to Admire analysis. The source data for the analysis comes from Ycharts.). We selected these metrics based on correlation work with Arizona State University in 2012. The Supply Chains to Admire analysis is six-years-old. Click the link to see the detail.)
Inventory Management The key starting point is implementing proper ABC analysis, and you need to look at it from multiple angles. It’s not enough to just categorise by product groups; you’ve got to dig deeper into line item analysis. Distribution Network Distribution networks need regular health checks to stay healthy.
Using balance sheet data from 2011 to 2019, we chart companies’ progress by peer group on rate of improvement and performance in the metrics of growth, operating margin, inventory turns, and Return on Invested Capital (ROIC). A focus on functional metrics throws the supply chain out of balance.)
billion rate data points monthly to provide the most comprehensive view of the market, helping you identify savings opportunities and make data-driven decisions. billion rate data points monthly to provide the most comprehensive view of the market, helping you identify savings opportunities and make data-driven decisions.
For the past eight years, each spring, I have spent six weeks deep in the analysis of spreadsheets evaluating the corporate performance of supply chains by sector. In the analysis, we use this balanced scorecard to evaluate ten years of performance. The metrics selection resulted from work with Arizona State University in 2013.)
I am delving into COV (coefficient of variation) analysis. It is for this reason, that I use COV analysis to type logical supply chain flows. Most supply chain leaders cannot get their groove on because they generalize–the use of the same metric targets and tactics for the supply chain without paying attention to the flows.
A disruption at any point in the global logistics network including the average of 12 touch points from shipment packaging to final delivery can prove disastrous for profits, service levels, customer loyalty, and other key metrics. With the global e-commerce market predicted to reach $8.1
We talk about the move from functional metrics to a balanced scorecard, but we don’t use a balanced scorecard as an objective function. Our analysis shows that 67% of the Gartner Top 25 companies underperform their peer group on growth, 44% on operating margin, and 41% on inventory turns.
If the arrow is red, the industry is moving backwards on a metric. While we agree that each of these companies are leaders with significant contributions to the industry, we do not find these companies outperforming when compared against their peer groups on a balanced portfolio of metrics. What can we learn from the analysis?
It is now our fifth year of analyzing balance sheets to understand which companies are outperforming their peer groups on the metrics of growth, operating margin, inventory turns and Return on Invested Capital (ROIC) while driving improvement. It takes us three months and two full-time research assistants to finish the analysis.
The formula for OTIF is: Measuring a supply chain against OTIF metrics is a key strategy that helps decision makers attach a tangible value to the success of their fulfillment and allows them to determine key strategies. The ability to meet fulfillment goals is impeded by several issues.
We’ll examine the key components of efficient supply chains, explore essential performance metrics, and uncover the fundamental drivers that influence efficiency. Efficient supply chains strengthen collaborative relationships through automated communication systems and shared performance metrics.
Pattern recognition is the ability to discern patterns in data and use the insights for further analysis. The use of orbit charts allowed me to see the patterns of performance at the intersection of metrics over time. Wikipedia In 2014, I was exploring methods to publish what is now the Supply Chains To Admire report.
For organizations layered in functional metrics and driving a cost agenda, this is a tough nut to crack. I don’t care what you call it, but network design, what-if analysis, simulation and digital twin approaches grow in importance.) Tougher than most understand. Steps to Take Here are three steps to take: Adaptive Modeling.
Agility relies on having this kind transparency at your fingertips, through concurrent planning, so you aren’t waiting on analysis and a report from a link up or down the chain. Scenario analysis allows you to weigh alternatives by calculating the effects of possible changes.
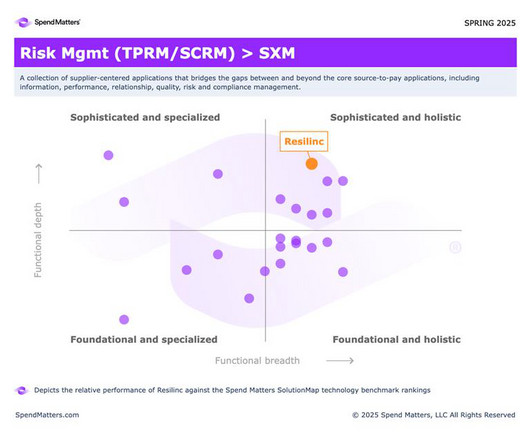
Where Resilincs Supply Chain Technology Excels Spend Matters’ independent analysis provides valuable insights into our platform’s capabilities. The Numbers That Matter One metric from the Spend Matters analysis stands out above all others: our 9.0 customer satisfaction score.
However, key stakeholders emerged outside official rolesindividuals not tagged as SMEs or change agentswho played critical roles in driving change impact analysis and influencing key design decisions. interviews) with quantitative metrics (e.g., In the IBP case study, initial appointments of change agents were based on formal roles.
Ultimately, what KPIs, as metrics and indicators derived from the set of plans are taken into account and prepared for each scenario. This also considers elements of predictive and prescriptive analysis and in-memory processing. Technology for Effective Planning.
Production Capacity Analysis While traditional testing methods can be time-consuming and offer incomplete data, focusing on key production metrics within the manufacturing process provides more actionable insights. Consider these essential metrics: Asset Utilization: How efficiently are your machines being used?
The focus is on functional metrics, but are unable to get to overall supply chain metrics. Listening posts use sentiment analysis based on unstructured text mining. Example of Social Sentiment Analysis. Companies are drowning in data, but struggle to get insights. These are all great candidates for listening.
We organize all of the trending information in your field so you don't have to. Join 102,000+ users and stay up to date on the latest articles your peers are reading.
You know about us, now we want to get to know you!
Let's personalize your content
Let's get even more personalized
We recognize your account from another site in our network, please click 'Send Email' below to continue with verifying your account and setting a password.


Let's personalize your content