This site uses cookies to improve your experience. To help us insure we adhere to various privacy regulations, please select your country/region of residence. If you do not select a country, we will assume you are from the United States. Select your Cookie Settings or view our Privacy Policy and Terms of Use.
Cookie Settings
Cookies and similar technologies are used on this website for proper function of the website, for tracking performance analytics and for marketing purposes. We and some of our third-party providers may use cookie data for various purposes. Please review the cookie settings below and choose your preference.
Used for the proper function of the website
Used for monitoring website traffic and interactions
Cookie Settings
Cookies and similar technologies are used on this website for proper function of the website, for tracking performance analytics and for marketing purposes. We and some of our third-party providers may use cookie data for various purposes. Please review the cookie settings below and choose your preference.
Strictly Necessary: Used for the proper function of the website
Performance/Analytics: Used for monitoring website traffic and interactions
To build an outside-in model, and use new forms of analytics, we must start the discussion with the question of, “what drives value?” In today’s architectures and functional metrics, value optimization does not exist. You are right. The answer is not th e Gartner Top 25.
Solvoyo has a metric they call the user acceptance rate. This metric measures the percentage of time the planners accept replenishment, transportation, or inventory plans as they are without any change in the timing of the delivery or the quantity to be delivered. You set a target inventory level. That’s an action.
These steps include sourcing and receiving inventory, storing inventory, order processing, picking and packing an order, shipping the order, and returns management. Factors like planning tools, inventory management, demand patterns, and innovations in technology contribute to the success or failure of fulfillment optimization.
Technologies such as artificial intelligence, IoT, and predictive analytics enable smarter inventory management, real-time tracking, and predictive maintenance, reducing waste and costs. This pillar is about creating value, reducing risks, and positioning the organization for long-term success.
Supply shortages resulting in empty shelves or parking lots of WIP inventory represent a spectre causing supply chain leaders to reconsider supply chain inventory practices. Opinion of just-in-time (JIT) as a practice has taken a battering and inventory is rising. Is supply chain inventory the problem?
Why should we consider Promotion Planning in Inventory Management? Whether it be e-commerce, brick-and-mortar, or both, retail companies care about the inventory they keep. During promotional management, especially for big events around special days and holidays, inventory levels need to be adjusted to meet the peaks in demand.
Picture this: You’re a warehouse manager, and with a few taps on your smartphone, you instantly know the exact location and quantity of every item in your inventory. That’s not science fiction—it’s the power of mobile inventory management. Ready to turn your inventory from a headache into a strategic asset?
That’s where data analytics comes in. By harnessing the power of data science and analytics, you can gain end-to-end visibility across your entire network, breaking down information silos and optimizing every stage of your operations. In this post, we’ll explore how data analytics can revolutionize your supply chain.
Suddenly, managing inventory is the name of the game for companies trying to manage working capital and maximize profit while keeping customers happy. And that’s where real-time perpetual inventory signals come in. Plus, accurate inventory information is the key to optimal decision-making.
A disruption at any point in the global logistics network including the average of 12 touch points from shipment packaging to final delivery can prove disastrous for profits, service levels, customer loyalty, and other key metrics. With the global e-commerce market predicted to reach $8.1 billion to $23.07
Over the last six years, we studied the connection between business results (growth, operating margin, inventory turns and Return on Invested Capital (ROIC)) and the link to company characteristics. Reward teams for cross-functional metrics. Focus functional metrics to improving reliability. Maturity in Analytics.
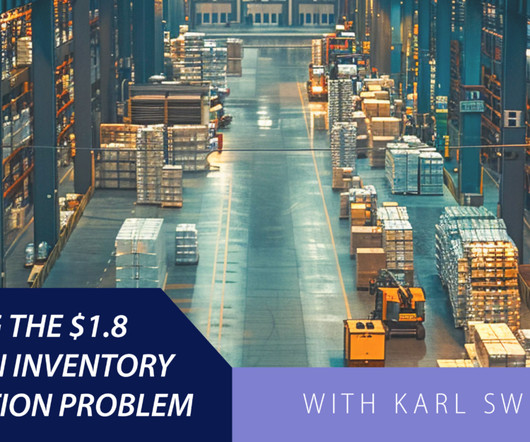
trillion distortion inventory problem. Trillion Inventory Distortion Problem In this podcast, Karl Swensen, CEO and Co-founder of Pull Logic, discusses how their AI-enabled technology helps retailers, brands, and manufacturers reduce lost sales by addressing supply chain and selling process failure points. Summary: Solving the $1.8
Returns Management and Integration With 35% of online purchases being returned, predominantly to physical stores, retailers are grappling with the ripple effects on inventory management. Early adopters of these integrated platforms report significant improvements in inventory turnover and reduction in stockouts.
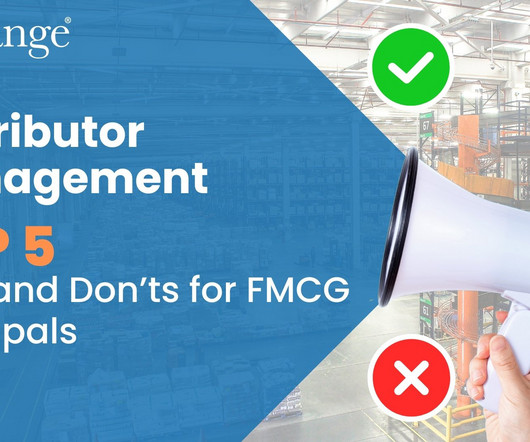
Do Set Clear KPIs and Governance Structures : Establish transparent metrics for sales, coverage, and service levels. Do Embrace Technology and Data : Use real-time data for demand forecasting, inventory management, and route optimization. A well-equipped distributor is an extension of your brand and a key to market penetration.
Even more impressive, lost sales due to stockouts can decrease by up to 65%, while inventory reductions of 20% to 50% are possible. This advanced analysis allows businesses to predict promotional lift with unprecedented accuracy, ensuring optimized production schedules and inventory positioning through sophisticated supply planning.
Key technologies like blockchain, IoT, and AI offer foundational support for DPPs by ensuring data security, real-time monitoring, and advanced analytics. This integration includes tracking individual components and collecting data on environmental impact, including sustainability metrics such as carbon footprint and recyclability.
Container inventory is imbalanced. We cannot change things overnight, but there are some steps that we can take through the use of advanced analytics. Fourteen of twenty-eight industries have rising inventories. Invest in analytics to sense and translate demand. Containers wait at each ship node for the chassis.
Container inventory is imbalanced. We cannot change things overnight, but there are some steps that we can take through the use of advanced analytics. Fourteen of twenty-eight industries have rising inventories. Invest in analytics to sense and translate demand. Containers wait at each ship node for the chassis.
In the automotive sector, manufacturers are simultaneously reducing inventory costs and delivery times. We’ll examine the key components of efficient supply chains, explore essential performance metrics, and uncover the fundamental drivers that influence efficiency.
Inventory is the lifeblood of any manufacturing business. By leveraging analytics and key performance indicators (KPIs), manufacturers can optimize inventory, reduce waste, and boost profitability. Tracking inventory flow and performance across your supply chain is a must. But what exactly should you measure?
And the impact doesn’t stop there, since trade-off decisions will be required to answer questions like which customer is most important to satisfy with the limited bolts in inventory and if production capacity should be reallocated. Analytics inform decisions. Agility to act on transparency.
Only four percent of companies compared to their peer groups improved balance sheet performance of growth, operating margin, and inventory turns. When compared to pre-recession years, we ended the decade with twenty more days of inventory. Days of Inventory Comparison. Now, let’s take consumer products. What can we learn?
By embedding analytics across logistics, sourcing, and fulfillment, businesses gain the visibility and foresight needed to stay competitive.Analytics-driven leadership is no longer a luxury; it’s the foundation of operational survival in todays volatile business environment. Analytics allows organizations to move beyond intuition.
While the performance rankings were based on comparisons of inventory turns, operating margin and Return on Invested Capital (ROIC) for the periods of 2006-2013 and 2009-2013, the concept is that to be a supply chain leader you must outperform and drive improvement. The use of channel data into advanced analytics to sense demand.
A shift from functional metrics to a balanced scorecard. I like the use of growth, margin, inventory turns, Return on Invested Capital, customer service and ESG metrics. The focus on functional metrics sub-optimizes balance sheet results. Funny, isn’t it? Improved Forecast Value Added (FVA).
Using balance sheet data from 2011 to 2019, we chart companies’ progress by peer group on rate of improvement and performance in the metrics of growth, operating margin, inventory turns, and Return on Invested Capital (ROIC). A focus on functional metrics throws the supply chain out of balance.) We Give to You.
BOSTON, February 16, 2022 : ToolsGroup , a global leader in supply chain planning and optimization software, has partnered with Planalytics to integrate their weather-driven demand (WDD) analytics with ToolsGroup’s retail planning solutions, enabling customers to isolate, measure, and manage the influence of weather on their businesses.
There is so much data, and to make use of it, we need to use data mining and analytics to drive meaningful insights that can be put to some good use. ABC Analysis for Inventory Planning : Clustering products that behave similarly highlights issues, challenges, and opportunities for serving customers better.
For instance, a student struggling with inventory management concepts can receive supplementary materials, interactive simulations, and one-on-one tutoring sessions tailored to their needs. Developing Analytical Skills Data analysis is at the heart of effective supply chain management.
Form and socialize your own hierarchy of metrics. Design your supply chain with a focus on the form and function of inventory. Here is the metrics framework that I am using at present in my outside-in classes. For example, don’t focus on forecast error.
The future inventory fire sale. One of my stark realizations this year is that smaller companies are beating larger and often more established companies on growth metrics, inventory turns, operating margin, and Return on Invested Capital (ROIC). (In The metrics selection resulted from work with Arizona State University in 2013.)
Instead, what I observed when I looked at the data, was that most companies that I had worked with (in my role as an industry analyst, I had worked with over 300) were going backwards on margin and inventory turns. Resiliency is the pattern at the intersection of operating margin and inventory turns. “Ugh,” I said.
By maximizing space utilization, improving inventory control , and boosting workflow efficiency, you can unlock significant cost savings and elevate your customer service game. Essential technology solutions, including Warehouse Management Systems (WMS), Inventory Management Systems (IMS), and the transformative power of IoT and automation.
How are companies rethinking their liquidity management strategies in response to the recent degradation across major working capital metrics? In the wake of economic uncertainty, many companies have experienced a degradation in key working capital metrics.
The consulting team pitches a theme–vision of supply chain best practices, big data analytics, or demand-driven value networks– to the executive team, and a new project is initiated. In addition, I am now done with the page proofs for my new book, Metrics that Matter. The first step in the journey is a kick-off meeting.
If you want to gain more supply chain analytics knowledge, you’re in the right place. We’ve compiled a list of 10 great supply chain analytics books to help you better understand the concepts and strategies behind this vital business field.
I also continued to work on the manuscript for the book Metrics That Matter to publish in the fall of 2014. So, I am going to focus here and share my answer: Demand sensing is the application of analytic technologies to detect short-term patterns in channel data and translate it into distribution requirements. It is frequently asked.
Some supply chain companies are leaning on the power of analytics to help streamline their processes and get ahead of their competitors. But many companies have struggled to embrace the relationship between using analytics and implementing changes that can improve business performance. But the benefits far outweigh the challenges.
Delays and congestion worsen each year, inventory strains continually affect capacity, and customer needs remain ever-changing. Focusing on the transportation metrics that have the greatest impact on the supply chain can help managers stay attentive to both short-term and long-term goals and needs. .
Supply chain resilience refers to planning for things that could go wrong and then creating inventory buffers or contingency plans. SCP solutions provide a solid ROI based on hitting targeted service levels with less raw material, work-in-process, or finished goods inventory. This would be a three-way tradeoff.
Supply chains must be connected and collaborative so all links can align to business strategy and oriented toward a common set of the most important metrics (and not functional metrics that drive siloed behavior). But to operate at the board level we need to be able to speak the CFO’s language. Spike up to protect against attack.
It’s a natural fit for an environment built on orchestration across vendors, partners, inventory, and data. Immediately, the agent reoptimizes inventory routes in North America and updates the customer in Europe all without human involvement. ” What makes supply chains an ideal proving ground for this evolution?
Align Inventory Placement With Demand. Retailers must align inventory placement , its physical location, with demand. This means moving inventory to make it closer to markets where it is sells. Develop Metrics to Track the Effectiveness and Efficiency of the Omnichannel Strategy. The next step is simple.
We organize all of the trending information in your field so you don't have to. Join 102,000+ users and stay up to date on the latest articles your peers are reading.
You know about us, now we want to get to know you!
Let's personalize your content
Let's get even more personalized
We recognize your account from another site in our network, please click 'Send Email' below to continue with verifying your account and setting a password.


Let's personalize your content