This site uses cookies to improve your experience. To help us insure we adhere to various privacy regulations, please select your country/region of residence. If you do not select a country, we will assume you are from the United States. Select your Cookie Settings or view our Privacy Policy and Terms of Use.
Cookie Settings
Cookies and similar technologies are used on this website for proper function of the website, for tracking performance analytics and for marketing purposes. We and some of our third-party providers may use cookie data for various purposes. Please review the cookie settings below and choose your preference.
Used for the proper function of the website
Used for monitoring website traffic and interactions
Cookie Settings
Cookies and similar technologies are used on this website for proper function of the website, for tracking performance analytics and for marketing purposes. We and some of our third-party providers may use cookie data for various purposes. Please review the cookie settings below and choose your preference.
Strictly Necessary: Used for the proper function of the website
Performance/Analytics: Used for monitoring website traffic and interactions
” Traditional planning models optimize functional processes to improve cost and customer service. The problem is that the reduction of costs within one function does not necessarily drive value. In today’s architectures and functional metrics, value optimization does not exist. You are right.
For senior leaders, understanding and integrating the three pillars of sustainability—environmental, social, and economic—into supply chain strategies is essential. Reducing carbon emissions is a cornerstone of this effort. Meanwhile, advances in AI-driven route optimization reduce unnecessary mileage, cutting emissions and costs.
The transition to renewable energy and the adoption of sustainable practices are now essential for reducing environmental impact, ensuring regulatory compliance, and maintaining competitiveness. Businesses face heightened uncertainty in managing costs and securing stable energy supplies.
However, as carbon taxes and emissions reporting requirements continue increasing, supply chain professionals face mounting pressures from inside and outside their organizations to measure and improve performance against new, nebulous sustainability metrics. Freight transportation makes up over 10% of total global carbon emissions.
Just by embedding analytics, application owners can charge 24% more for their product. How much value could you add? This framework explains how application enhancements can extend your product offerings. Brought to you by Logi Analytics.
Reducingcost was the primary objective, and most operational decisionsfrom sourcing to fulfillmentreflected that mindset. Resilience is the ability to respond to disruption while maintaining core operations, and more companies are shifting their strategies accordingly. For years, supply chains were engineered to be lean.
Open Sky Group, a global leader in supply chain execution solutions, has announced a strategic partnership with Easy Metrics , a premier provider of labor management and warehouse performance management solutions.
According to Gartner , early stages of S&OP maturity often lack formal processes, metrics, and cross-functional participation. It connects strategy and execution with features built for modern supply chains: 1. Most S&OP efforts break down due to disconnected systems, siloed data, and a lack of cross-functional engagement.
From balancing cost-efficiency with ethical sourcing to enhancing transparency and integrating corporate social responsibility (CSR), businesses face mounting pressure to align their operations with sustainability, technology, and energy practices.
A lack of standardized ESG metrics across industries and regions makes it challenging to consistently evaluate and compare supplier performance. Cost pressures can complicate ESG efforts. Suppliers that meet higher sustainability standards may charge more, putting tension between cost optimization and sustainability goals.
This integrated approach enables Summit to reduce idle time and fuel wastage, aligning with its goal of net-zero emissions by 2050. ORION has proven essential in reducing travel distances, as well as cutting down on greenhouse gas emissions associated with unnecessary mileage.
Further, while 88% of supply chain executives report that their organization’s supply chain plays a vital role in enhancing the customer experience, their colleagues in the C-suite overwhelmingly (88%) view the supply chain function as a cost center. net promoter score or similar metric) as a supply chain KPI.
In follow-up qualitative interviews, one of the largest issues with organizational alignment was metric definition and a clear definition of supply chain excellence. For example, a cost improvement in one function could raise the costs in another. Error is error, but is it the most important metric? What Drives Value?
Yes, a time when well-meaning supply chain leaders share their strategy decks for the upcoming year and ask me for an opinion. How do we design work systems to align organizations and ensure that there is the right balance of reward systems with metrics? It is that time of year. The reason? Most because they are stuck.
Functional Metrics and the Lack of Alignment to Strategy. Few companies are clear on the number of supply chains they operate, design the rhythms and cycles of each, and align metrics to the strategy. Most focus on costreduction, assuming that functional cost translates to operating margin.
Demand forecasting is a critical strategy for supply chain management that can dramatically improve business decision-making and financial performance. However, securing leadership buy-in for demand forecasting technology requires a strategic approach that clearly demonstrates value.
In the automotive sector, manufacturers are simultaneously reducing inventory costs and delivery times. We’ll examine the key components of efficient supply chains, explore essential performance metrics, and uncover the fundamental drivers that influence efficiency.
Read on to explore key AI use cases in procurement, the challenges businesses face, strategies to overcome them, and the exciting opportunities AI brings for the future. This gives them advance warning so they can adjust their purchasing strategies. Here are the topics we’ll cover at a glance : What is AI in procurement?
” My problem is that we move through these hype cycles with little accountability for spending and with a major opportunity cost to not redefine work. Yawn and walk on if the answer is i mproving demand error or reducing inventory levels. Did you know that improvement in the supply chain drives 50-70% of this value metric?
This doesnt eliminate those systems, it organizes the data they produce. This reduces reliance on manual tracking or last-minute phone calls. Orchestration tools help keep everyone working from the same information, reducing the chance of miscommunication between departments or suppliers.
Effective inventory optimization directly impacts customer satisfaction, loyalty, operational costs, and waste reduction making it a critical business function in todays volatile market. End-to-end integration : Evaluates multiple demand scenarios to position inventory in the most cost-effective manner possible.
Balancing increased demand with consistent quality and controlled costs is difficult but essential for manufacturers looking to expand. Understanding Scaling Manufacturing The manufacturing business relies on scalability to increase production output efficiently without a proportional increase in costs.
vehicle imports remains in place, though discussions on reducing it are ongoing. Steel and Aluminum The agreement eliminates the 25% tariffs previously applied to UK steel and aluminum exports to the U.S. beef from 1,000 to 13,000 metric tons , removing the 20% tariff within that limit. The UKs current 10% tariff on U.S.
This unlocks enormous value as you eliminate time lags, lower costs, and slash inventory buffers across the network. This strategy enables companies to achieve four critical objectives: Unlock value trapped in the supply network that is due to poor data quality and communication. The Downfall of Enterprise-Centric Technology.
billion rate data points monthly to provide the most comprehensive view of the market, helping you identify savings opportunities and make data-driven decisions. Ready to Transform Your Freight Operations?
Standard sizes and categorizations play a crucial role in determining the costs associated with shipping products that meet standard criteria in fulfillment centers. Fulfillment costs can significantly impact profit margins, making it crucial for businesses to understand these financial implications and how they influence consumer spend.
The company is operationalizing this target by reducing emissions as much as possible, increasing use of carbon-free electricity, and removing the emissions that remain. Supporting hypergrowth while reducing supply chain logistics emissions is not an easy feat. A clear goal needs to be combined with good data and metrics.
This team controls what’s bought, from where, and at what cost for the entire organization. These benefits aren’t just about lower prices; they’re also about reducing transportation and inventory costs, which can really add up over time. They also continuously track supplier performance.
Creating a data-driven supply chain tracking important transportation metrics helps shippers respond and adapt as quickly as possible to known and unknown events. Why Monitor Transportation Metrics. Transportation metrics provide visibility that helps drive operative and competitive advantages.
Rising costs, supply chain chaos, and economic swings put businesses under enormous pressure to protect their margins. According to McKinsey & Company, procurement accounts for 50% to 80% of a company’s cost base. That’s why organizations zero in on strategies to achieve procurement costreduction.
And to handle it all effectively, you need to get the hang of some of the best SEO strategies tailor-made for logistics companies. It enables the users to monitor the websites’ paid and organic traffic, keywords, and traffic costs. The approach is integral to the best marketing strategies.
You’ll learn how to leverage data to streamline operations, reducecosts, improve efficiency, and exceed customer expectations. Various supply chain optimization techniques, such as detailed planning, assessing current practices, and automating processes, can significantly enhance efficiency and reducecosts.
In the past few decades, an increasing number of organizations have adopted environmental, social and governance ( ESG ) initiatives to help heal the planet as well as to make cost and efficiency improvements in their supply chain and procurement operations. What obstacles are companies facing in making the most of this opportunity?
How aligned do you believe your organization is to drive these metrics? One of my favorite stories was his initiative to reduce the number of cuts of carrots in soups from 33 to three. A good leader knows that costreductions in the back office does not necessarily improve margins. Reduce Variability and Latency.
The DOE is still issuing large federal loans to startup companies, Novonix a synthetic graphite startup just received a $755 million loan to support its mission and reach its goal of producing 31,500 metric tonnes of synthetic graphite. Department of Energy to build a synthetic graphite facility in Chattanooga, Tennessee.
The global freight sector faces growing pressure to balance cost-efficiency with environmental responsibility. With freight transport accounting for a significant share of global emissions, efforts to improve logistics now extend beyond operational metrics to include resilience, regulatory compliance, and climate performance.
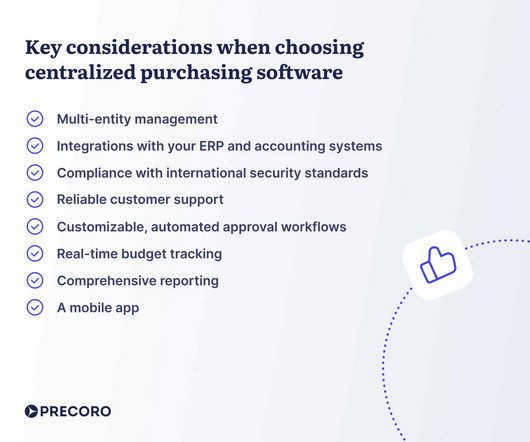
Enterprise procurement leaders are under more pressure than ever—juggling cost control, compliance, supplier risk, and internal complexity, all while trying to modernize outdated systems. That’s why many organizations are undergoing procurement transformation , and shifting from manual, siloed processes to connected, data-driven strategies.
Misaligned priorities, siloed systems, and unclear ownership can directly impact key performance indicators like cost savings percentage and procurement cycle time. Discover how Ivalua’s Supply Chain Collaboration solution empowers you to work more closely with suppliers, reduce risk, and build a more agile, connected supply chain.
He is responsible for driving strategy, customer engagement, and industry analysis. Data-Driven Decision Making: By leveraging DAT’s data and analytics, businesses can make data-driven decisions to improve efficiency, reducecosts, and enhance customer satisfaction.
You’re expected to ship more orders, faster, with fewer errors — all while managing rising costs and shrinking labor pools. It’s a tough challenge, and if you’re relying on outdated processes and technology, it’s likely costing you more than you realize. Think real-time inventory visibility across all your locations.
Would their jobs be eliminated? Their jobs were gradually eliminated. Learn that the traditional goals of supply chain focused on functional costreduction sub-optimize the value of the firm. Form and socialize your own hierarchy of metrics. When computers were distributed to managers, Evelyn and Rose were scared.
We remain committed to growing our business with prudent investments and cost discipline to build the premier network and technology for logistics-intensive businesses." Issuances of common shares, net of issuance costs 3.6 Once completed, Descartes anticipates annualized cost savings of approximately $15 million.
For logistics professionals, this translates to smarter warehouse layouts, more accurate transportation planning, proactive maintenance scheduling, and a new level of resilience through cost-to-serve optimization. This article explores how digital twins are being deployed in transportation, warehousing, and network design.
Rising costs, geopolitical tensions, and tariffs demand a strategic and holistic approach to maintain profitability and competitive advantage. There are many ways an organization can cut supply chain costs. For many large enterprises, procurement makes up a large part of a company’s total costs.
We organize all of the trending information in your field so you don't have to. Join 102,000+ users and stay up to date on the latest articles your peers are reading.
You know about us, now we want to get to know you!
Let's personalize your content
Let's get even more personalized
We recognize your account from another site in our network, please click 'Send Email' below to continue with verifying your account and setting a password.


Let's personalize your content