This site uses cookies to improve your experience. To help us insure we adhere to various privacy regulations, please select your country/region of residence. If you do not select a country, we will assume you are from the United States. Select your Cookie Settings or view our Privacy Policy and Terms of Use.
Cookie Settings
Cookies and similar technologies are used on this website for proper function of the website, for tracking performance analytics and for marketing purposes. We and some of our third-party providers may use cookie data for various purposes. Please review the cookie settings below and choose your preference.
Used for the proper function of the website
Used for monitoring website traffic and interactions
Cookie Settings
Cookies and similar technologies are used on this website for proper function of the website, for tracking performance analytics and for marketing purposes. We and some of our third-party providers may use cookie data for various purposes. Please review the cookie settings below and choose your preference.
Strictly Necessary: Used for the proper function of the website
Performance/Analytics: Used for monitoring website traffic and interactions
If your systems are disjointed and you lack the ability to analyze masses of data in real time, you will struggle to deliver on-time, in-full and your reputation and revenue will be negatively impacted. This blog is Part 1 in our Optimizing Supply Chain Performance with Unified Data series, with a focus on optimizing fulfillment.
In today’s architectures and functional metrics, value optimization does not exist. And, when procurement and tactical planning operate in isolation, there is no decision support framework to guide the trade-offs especially when the functions are tethered to different and conflicting metrics. You are right.
In follow-up qualitative interviews, one of the largest issues with organizational alignment was metric definition and a clear definition of supply chain excellence. In my post Mea Culpa, I reference my work with the Gartner Supply Chain Hierarchy of Metrics. Error is error, but is it the most important metric? My answer is no.
The big data architectures are often present in the current “AI offerings.” The use of python and big-data architectures enables the ingestion of unstructured and streaming data that can move the model from inside-out (using enterprise data) to outside-in (use of market data).
This uncertainty makes dynamic inventory replenishment optimization essential for business success. Effective inventory optimization directly impacts customer satisfaction, loyalty, operational costs, and waste reduction making it a critical business function in todays volatile market.
Solvoyo has a metric they call the user acceptance rate. This metric measures the percentage of time the planners accept replenishment, transportation, or inventory plans as they are without any change in the timing of the delivery or the quantity to be delivered. If a user makes changes to the plan, they log that data.
Creating a data-driven supply chain tracking important transportation metrics helps shippers respond and adapt as quickly as possible to known and unknown events. Why Monitor Transportation Metrics. Actionable data is one of the most critical business drivers.
Supply chain orchestration is about managing the movement of goods, data, and decisions across the entire supply networkstarting with suppliers and continuing through to the customer. Why Orchestration Matters The more connected a supply chain becomes, the more it depends on timely, accurate data and consistent communication across teams.
This is amplified across the supply chain into an exponential impact on inventory and planned orders for manufacturing. Inventory Health. I find only 8% of companies actively measure inventory health. Few organizations have the ability to manage the form & function of inventory. Measure inventory health.
That’s where data analytics comes in. Modern supply chains thrive on real-time data, execution-focused applications, and dynamic decision-making. In this post, we’ll explore how data analytics can revolutionize your supply chain. Demand Forecasting: Analyze past data to predict future needs.
Returns Management and Integration With 35% of online purchases being returned, predominantly to physical stores, retailers are grappling with the ripple effects on inventory management. Early adopters of these integrated platforms report significant improvements in inventory turnover and reduction in stockouts.
But shippers looking to avoid disruptions and ensure that tight inventory levels don’t lead to missed sales opportunities pulled their orders forward. As companies look ahead to the next three to six months, they’re weighing costs, risks, and demand as they plan and adapt their inventory strategies.
Assessing Infrastructure and Technological Capabilities The first step in the readiness assessment is to evaluate the organization’s IT infrastructure and data management systems. Organizations must also evaluate the quality, integrity, and security of their data to ensure it is reliable enough for DPP purposes.
Offering comprehensive solutions, including warehousing, order fulfillment, and inventory management, Launch Fulfillment helps eCommerce brands streamline their supply chains. Client Access & Transparency: Provides client access to their shipping data for increased transparency and decreased administrative overhead.
Picture this: You’re a warehouse manager, and with a few taps on your smartphone, you instantly know the exact location and quantity of every item in your inventory. That’s not science fiction—it’s the power of mobile inventory management. Ready to turn your inventory from a headache into a strategic asset?
A disruption at any point in the global logistics network including the average of 12 touch points from shipment packaging to final delivery can prove disastrous for profits, service levels, customer loyalty, and other key metrics. With the global e-commerce market predicted to reach $8.1 billion to $23.07
Suddenly, managing inventory is the name of the game for companies trying to manage working capital and maximize profit while keeping customers happy. With crystal clear, up-to-the-minute, and accurate data that enables organizations to see what’s happening across their entire supply chain and take smart, decisive action.
Drip Big Data. The issue is that when companies optimize functional metrics, they throw the supply chain out of balance and sub-optimize value. To use optimization, the data had to be cleaned and stored in pristine condition in a data jail (rows and columns of traditional database technologies). Industry 4.0.
By developing strategies for design, supply, production, distribution, and inventory, planning provides a foundation for product innovation and plays a key role in product simplification and SKU rationalization. Supply chain professionals use various tools, including supply chain modeling, inventory management, and forecasting.
This year, a recurring theme that I saw was about using supply chain data to improve the customer experience across the entire value chain. Here are the ones that stood out to me, especially as it relates to supply chain data. The single data cloud runs on Snowflake, one of Blue Yonder’s partners.
Teams make recommendations based on latent data to their managers, but decisions are often bogged down in meetings and corporate politics. In this role, you would design data flows to enable self-service planning processes where the planner becomes the orchestrator to help business leaders make the decisions at the speed of business.
Supply shortages resulting in empty shelves or parking lots of WIP inventory represent a spectre causing supply chain leaders to reconsider supply chain inventory practices. Opinion of just-in-time (JIT) as a practice has taken a battering and inventory is rising. Is supply chain inventory the problem?
Why should we consider Promotion Planning in Inventory Management? Whether it be e-commerce, brick-and-mortar, or both, retail companies care about the inventory they keep. During promotional management, especially for big events around special days and holidays, inventory levels need to be adjusted to meet the peaks in demand.
Data is the lifeblood of AI in the supply chain. Without sufficient data, AI models can’t uncover meaningful patterns, make accurate predictions, or provide valuable insights for informed decision-making in complex and dynamic environments. At the same time, feeding your AI models too much data can also be a problem.
Neils here is some feedback to consider: VMI: Vendor-managed inventory logic enables the downstream trading partner to manage inventories and the sell-through the channel. VMI has great promise in the use of channel data and the management of flow. I have lived through four hype cycles of outside-in processes.
Leading organizations are building supply chains that are less exposed to single points of failure, more informed by real-time data, and more able to adjust sourcing, inventory, and routing based on current conditions. Metrics must reflect the new priorities. What if lead times from a key port double?
Despite the evolution of technology, none of the 28 industry segments I follow can drive improvement at the intersection of operating margin and inventory turns. That tightly integrated advanced planning (APS) coupled to Enterprise Resource Planning (ERP) using order data is sufficient. Change is Hard. Unlearning is Tougher.
The research methodology for the Supply Chains to Admire compares the performance of a company against its industry peer group for the metrics of Year-over-Year Revenue Growth, Inventory Turns, Operating Margin, and Return on Capital Employed (ROCE). Today, companies measure too many metrics without a clear definition of value.
That’s the power of manufacturing data collection. Data transforms operations. Manufacturing data collection is your secret weapon for boosting efficiency, cutting waste, and staying ahead of the competition. Let’s dive in and unlock the potential of your manufacturing data.
My goal is to convince you to ground supply chain processes and technology implementations in data analysis while tying the results to the improvement in corporate performance. Only four percent of companies compared to their peer groups improved balance sheet performance of growth, operating margin, and inventory turns.
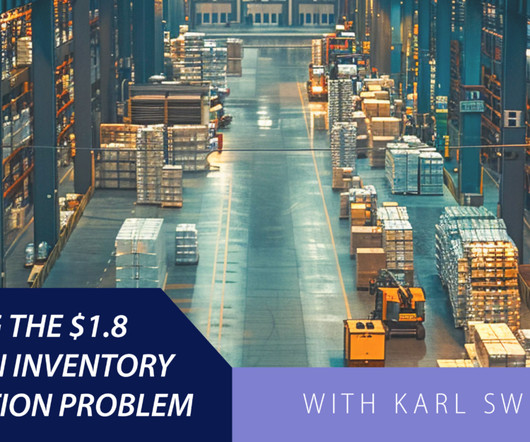
trillion distortion inventory problem. Trillion Inventory Distortion Problem In this podcast, Karl Swensen, CEO and Co-founder of Pull Logic, discusses how their AI-enabled technology helps retailers, brands, and manufacturers reduce lost sales by addressing supply chain and selling process failure points. Summary: Solving the $1.8
AI-powered warehouse management improves inventory flow and reduces waste. Blockchain also facilitates collaboration by sharing verified data across stakeholders. Blockchain also facilitates collaboration by sharing verified data across stakeholders. Immutable records enable accountability throughout the supply chain.
In the automotive sector, manufacturers are simultaneously reducing inventory costs and delivery times. We’ll examine the key components of efficient supply chains, explore essential performance metrics, and uncover the fundamental drivers that influence efficiency.
For demand forecasting, this means looking beyond mere accuracy to focus on: Strategic decision-making improvements Cost reduction strategies Inventory optimization Customer service enhancement 2.Understand Define Clear Business Outcomes The most successful technology investments start with a clear understanding of desired business outcomes.
Even more impressive, lost sales due to stockouts can decrease by up to 65%, while inventory reductions of 20% to 50% are possible. This advanced analysis allows businesses to predict promotional lift with unprecedented accuracy, ensuring optimized production schedules and inventory positioning through sophisticated supply planning.
A shift from functional metrics to a balanced scorecard. I like the use of growth, margin, inventory turns, Return on Invested Capital, customer service and ESG metrics. The focus on functional metrics sub-optimizes balance sheet results. Funny, isn’t it? Improved Forecast Value Added (FVA). Market-Driven Process.
At each company, there is a relationship between the metrics of growth, margin, inventory, customer service, and asset strategy. For the purpose of this article, I will use Return on Invested Capital (ROIC) as the proxy metric to discuss asset utilization.) Understanding this relationship requires modeling. (A A Case Study.
Do Set Clear KPIs and Governance Structures : Establish transparent metrics for sales, coverage, and service levels. Do Embrace Technology and Data : Use real-time data for demand forecasting, inventory management, and route optimization. Regular reviews and joint business planning foster accountability and trust.
Think about it: How much time is wasted hunting down misplaced inventory? How much could you save by streamlining your workflows and empowering your team with real-time data? These include: Barcode Scanning Devices: These handheld devices, equipped with integrated inventory management apps, enable real-time tracking and data entry.
The future inventory fire sale. One of my stark realizations this year is that smaller companies are beating larger and often more established companies on growth metrics, inventory turns, operating margin, and Return on Invested Capital (ROIC). (In The metrics selection resulted from work with Arizona State University in 2013.)
Using balance sheet data from 2011 to 2019, we chart companies’ progress by peer group on rate of improvement and performance in the metrics of growth, operating margin, inventory turns, and Return on Invested Capital (ROIC). The charts and data get boring pretty quick.) The reason?
IoT: Powering the Future of Digital Product Passports The Internet of Things (IoT) continues to impact how industries track products and manage data. This network of devices enables seamless, automatic data collection from physical objects in near real-time.
Pattern recognition is the ability to discern patterns in data and use the insights for further analysis. The use of orbit charts allowed me to see the patterns of performance at the intersection of metrics over time. The first step was to find a reliable data set and establish the peer groups. We purchase data from Y charts.
Inventory is the lifeblood of any manufacturing business. Thats where data-driven decision-making comes in! By leveraging analytics and key performance indicators (KPIs), manufacturers can optimize inventory, reduce waste, and boost profitability. Tracking inventory flow and performance across your supply chain is a must.
We organize all of the trending information in your field so you don't have to. Join 102,000+ users and stay up to date on the latest articles your peers are reading.
You know about us, now we want to get to know you!
Let's personalize your content
Let's get even more personalized
We recognize your account from another site in our network, please click 'Send Email' below to continue with verifying your account and setting a password.


Let's personalize your content