This site uses cookies to improve your experience. To help us insure we adhere to various privacy regulations, please select your country/region of residence. If you do not select a country, we will assume you are from the United States. Select your Cookie Settings or view our Privacy Policy and Terms of Use.
Cookie Settings
Cookies and similar technologies are used on this website for proper function of the website, for tracking performance analytics and for marketing purposes. We and some of our third-party providers may use cookie data for various purposes. Please review the cookie settings below and choose your preference.
Used for the proper function of the website
Used for monitoring website traffic and interactions
Cookie Settings
Cookies and similar technologies are used on this website for proper function of the website, for tracking performance analytics and for marketing purposes. We and some of our third-party providers may use cookie data for various purposes. Please review the cookie settings below and choose your preference.
Strictly Necessary: Used for the proper function of the website
Performance/Analytics: Used for monitoring website traffic and interactions
I have learned that supply chain systems are more complex than I originally thought, and that the relationships between supply chain metrics are nonlinear. In my work on the Supply Chain Index , I see that companies I recognize as doing networkdesign well are rising faster on the list of the Supply Chain Index work.
At each company, there is a relationship between the metrics of growth, margin, inventory, customer service, and asset strategy. For the purpose of this article, I will use Return on Invested Capital (ROIC) as the proxy metric to discuss asset utilization.) Supply chain excellence was largely defined as manufacturing excellence.
We consistently see that companies focused on functional excellence–a focus within a functional silo like manufacturing, transportation or distribution– or singular metrics– like inventory or costs– underperform against their peer groups. Reward teams for cross-functional metrics. NetworkDesign Analysis.
The market for networkdesign tools was growing at a moderate rate, and most of the market had invested in technologies from either i2 Technologies (then termed i2 Strategist) or Logictools. Today, supply chain design has become a process all to its own. Instead, it needed to be steps of continuous designs. The reason?
For organizations layered in functional metrics and driving a cost agenda, this is a tough nut to crack. I don’t care what you call it, but networkdesign, what-if analysis, simulation and digital twin approaches grow in importance.) Tougher than most understand. Companies participating get a copy of the results.
I worked three layers down in the organization for a well-established leader in manufacturing named Dan. Dan had a very manufacturing view and Fred focused on logistics. His goal was to separate manufacturing and distribution inventories to improve his bonus incentives. The metrics were not aligned. You have to do so.
A networkdesign model figures out where factories and warehouses should be located. The key solutions are demand forecasting/inventory optimization, supply planning, and networkdesign. The key solution for this is networkdesign. Supply and networkdesign models are constraint-based models.
Manufacturing is designed and planned in isolation. Management and planning of the entire network against a value network strategy. Integration of corporate social responsibility metrics in planning. Integration with manufacturing systems to understand actual run times and Operating Efficiency (OEE).
This week, I will speak at Llamasoft’s conference on improving supply chain networkdesign. While innovation has slowed in Enterprise Resource Plannning (ERP) and Supply Chain Planning, I am bullish about some of the innovation coming from the supply chain networkdesign technology providers like JDA, Llamasoft and Solvoyo.
Based on the work with Georgia Tech, we are getting clear on which metrics matter by industry. As companies adopt a balanced scorecard, the functional metrics shift to a focus on reliability. For example, in manufacturing, the shift in focus is away from OEE to focus on first pass yield and schedule adherence.)
Management practices such as lean manufacturing and just-in-time inventory management, along with globalization, have made tremendous impact on cost and service, but have accentuated risk. Metrics such as lead-times, forecast accuracy, inventory levels, and service are used to measure operational risks. are most exposed to risk?
While I will know more when I finish the research than I do now, I want to encourage all readers in manufacturing and retail to participate. Active Work on Design and Modify. Networkdesign technologies are growing up and becoming part of enterprise architectures. Metrics Matter. It will close on March 15th.
While I will know more when I finish the research than I do now, I want to encourage all readers in manufacturing and retail to participate. Active Work on Design and Modify. Networkdesign technologies are growing up and becoming part of enterprise architectures. Metrics Matter. It will close on March 15th.
The company needs to focus on the design of flows, building outside-in processes, creating an effective supplier development group, reducing complexity, and driving bi-directional orchestration to a balanced scorecard. The manufacturing-centric company is used to strangling suppliers and demanding terms. So, you might ask, why?
Year after year, well intentioned people toiled against improving metrics that reduced, not improved, the effectiveness of the supply chain. The example that I give in the first post is the focus of manufacturing strategies to drive strong results to improve Return on Assets (ROA) that have actually caused a deterioration in operating margin.
In the annual report where they report on their key performance indicators (KPIs), they don’t just report on core financial metrics and the NPS, they also have people metrics. The company has shown sustained improvement on this metric. The company was designated an essential business that needed to stay open.
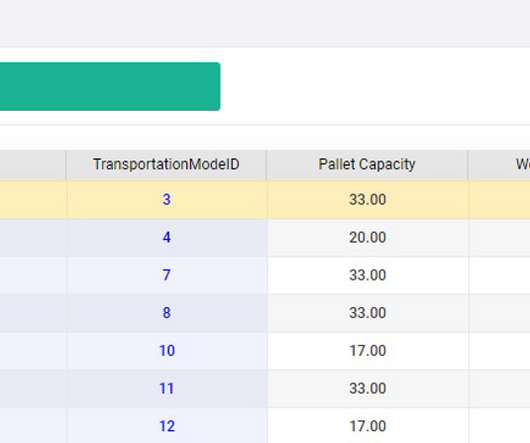
My first job was in manufacturing in the 1980’s. The metrics reward functional thinking. The focus of APICS is manufacturing, CSCMP’s foundation is in logistics, and ISM serves the procurement organization. In our research, the networkdesign maturity model shown in Table 1 is helpful to many of our clients.
Forget static networkdesigns and gut-feel decisions. By harnessing the power of data science and analytics, you can gain end-to-end visibility across your entire network, breaking down information silos and optimizing every stage of your operations. That’s where data analytics comes in.
The traditional manufacturing job defined the middle class. Each time, I turn on the channel, manufacturing jobs frame the global debate. Ironically, as global manufacturing jobs decrease, there is a need for talent for the global supply chain. Design planning processes to enable product lifecycle sensing.
Especially grievous are the gaps between finance and operations, manufacturing and procurement, and the operations and commercial teams. Each requires design and fine tuning. However, only 9% of companies actively design their supply chains. Over the last decade, supply chains have become more functional and less effective.
Let me start with a true confession: I am a manufacturing gal. I relished the sound of a manufacturing line when I opened the door of the factory in the morning, and I liked managing inputs so that we could maximize outputs. Manufacturing is the foundation of my interest in supply chain management. Supply Chain and Design.
No company in either the household non-durable (consumer goods) or the food manufacturing group beat their peer group on the balanced scorecard of growth, inventory turns, operating margin, and Return on Invested Capital (ROIC) for 2013-2022. Think about physical networkdesign. Most companies do not actively design flows.)
The number one question that I am asked today by manufacturers across all industries is “How can I improve customer service?” Granular data by volume is a must to be able to manage replenishment, networkdesign, and inventory targets. The two primary buffers in the supply chain are manufacturing capacity and inventory.
For example, if you were a contract manufacturer in China, you might already have different logistics networks for different customers. So, logistics networkdesign is a kind of initiative driven mainly by customer. 7) Adopt Both Service and Financial Metrics. 3) Align Demand Planning Across Supply Chain.
In the survey, APQC used a series of performance metrics, including net promoter score, customer retention rate, perfect order performance, and on-time delivery among others, to identify the top performing companies. Below are the results from the cross-industry report for environmental sustainability.
The best way to start the design of an agile supply chain is to look at the sources of variability and market volatility that your supply chain encountered in the prior year. These can be shift in the channel, issues in manufacturing, increasing variability in transportation, or a shift in commodity prices.
At the enterprise level, manufacturers and retailers focus on corporate efficiency. Figure 1: Current State of a Global Manufacturer of White Goods. Change internal metrics to a balanced scorecard and force the functions to work better together. Invest in networkdesign technologies. All are out of balance.
In manufacturing, IoT sensors ensure that each step of the process is tracked, ensuring that all materials meet required quality standards. Another challenge is device compatibility—different manufacturers produce IoT devices with varying standards, making it difficult to ensure frictionless communication between systems.
And, the strongest consulting partner for networkdesign is Chainalytics. I also like the work that is happening at the Demand-driven Institute on the redesign of manufacturing to be more demand driven. Over the last decade, the only metric that we have improved is revenue/employee (see below).
At the enterprise level, manufacturers and retailers focus on corporate efficiency. Figure 1: Current State of a Global Manufacturer of White Goods. Change internal metrics to a balanced scorecard and force the functions to work better together. Invest in networkdesign technologies. All are out of balance.
” At the other end of the continuum is the argument that “ Forecast error is the most important metric to improve.” I also worked in manufacturing during the period of 1978-1992 trying to plan demand. This is Planning by Design. ” I am in the middle. Here I share my world view. Everyone has a bias.
Notice how the water turns from blue to brown in Figure 3 with the lack of demand translation capabilities within the enterprise for manufacturing and logistics. Organizations can align to drive value despite the allegiance to functional metrics. With the increase in complexity, manufacturing cycle inventories rise. Mistake #5.
Unfortunately, we find most companies are moving backwards on the Supply Chain Metrics That Matter™ or making progress on singular metrics versus driving performance improvement on a balanced portfolio of supply chain metrics that correlate to market capitalization. (If The winners and finalists are an elite group.
Especially grievous are the gaps between finance and operations, manufacturing and procurement, and the operations and commercial teams. Each requires design and fine tuning. However, only 9% of companies actively design their supply chains. Over the last decade, supply chains have become more functional and less effective.
Especially grievous are the gaps between finance and operations, manufacturing and procurement, and the operations and commercial teams. Each requires design and fine tuning. However, only 9% of companies actively design their supply chains. Over the last decade, supply chains have become more functional and less effective.
metric tons of CO2 equivalent per million USD in revenue, down 58% from FY09 levels, despite daily package volumes rising by an average of 121%. FedEx says that since 2005, aviation emissions intensity (the amount of emissions per unit of activity) has dropped 31% and the company is aiming for a 40% reduction by 2034.
The increasing need for constantly analyzing these trade-offs across the supply chain networks has highlighted the need for digital twins and what-if capabilities in networkdesign solutions. The better the forecast and replenishment decisions, the higher the financial benefit and the lower the waste.
294 manufacturing facilities produced more than 90 million metric tons of food and beverage in 2021. PepsiCo products then reach shelves through its operating subsidiaries and a complex network of fleet operations. The multinational’s goal is to achieve net zero GHG emissions across their value chain by 2040.
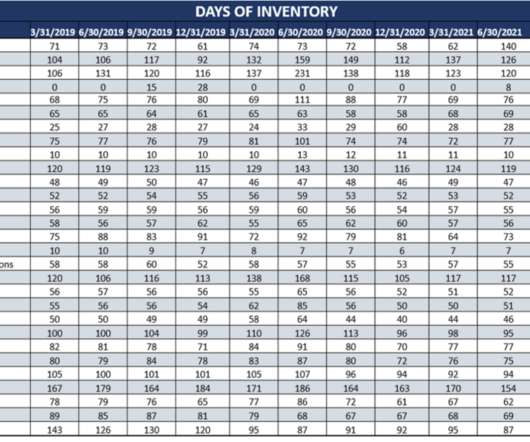
In my work with manufacturing companies recently, I am thinking a lot about the need for diagnostic testing. In Figure 1, we show the aggregate trend of the chemical industry in an orbit chart format showing year-over-year results at the intersection of two metrics operating margin and inventory turns. Let’s take an example.
Unfortunately, we find most companies are moving backwards on the Supply Chain Metrics That Matter™ or making progress on singular metrics versus driving performance improvement on a balanced portfolio of supply chain metrics that correlate to market capitalization. (If The winners and finalists are an elite group.
It is for this reason, that I discount the reporting by APQC, Institute of Business Forecasting (IBF) and Grocery Manufacturing Association (GMA) benchmarking data. Debra built the Gartner Hierarchy of supply chain metrics. With the lack of industry standard definition, self-reporting is not very useful. The reason is simple.
Instead, companies link suppliers to multiple signals: manufacturing production plans; distribution requirements; and current inventory positions, to help suppliers better plan for supply. Buffer Design. NetworkDesign to Reduce the Bullwhip Effect. Supply Chain Visibility and Supplier Connectivity.
Process manufacturers face a highly complex supply chain challenge. Add to these factors such as razor-thin margins, SKU-proliferation, globalization, and products that tend to be heavy, bulky and/or expensive to move and it quickly becomes apparent why process manufacturing supply chains are very challenging.
We are systemically evaluating each industry in the Supply Chain Insights Metrics That Matter series of reports. Networkdesign concepts are gradually gaining acceptance, but too few design their networks. At Supply Chain Insights , this is our passion.
We organize all of the trending information in your field so you don't have to. Join 102,000+ users and stay up to date on the latest articles your peers are reading.
You know about us, now we want to get to know you!
Let's personalize your content
Let's get even more personalized
We recognize your account from another site in our network, please click 'Send Email' below to continue with verifying your account and setting a password.


Let's personalize your content