This site uses cookies to improve your experience. To help us insure we adhere to various privacy regulations, please select your country/region of residence. If you do not select a country, we will assume you are from the United States. Select your Cookie Settings or view our Privacy Policy and Terms of Use.
Cookie Settings
Cookies and similar technologies are used on this website for proper function of the website, for tracking performance analytics and for marketing purposes. We and some of our third-party providers may use cookie data for various purposes. Please review the cookie settings below and choose your preference.
Used for the proper function of the website
Used for monitoring website traffic and interactions
Cookie Settings
Cookies and similar technologies are used on this website for proper function of the website, for tracking performance analytics and for marketing purposes. We and some of our third-party providers may use cookie data for various purposes. Please review the cookie settings below and choose your preference.
Strictly Necessary: Used for the proper function of the website
Performance/Analytics: Used for monitoring website traffic and interactions
Organizations must also evaluate the quality, integrity, and security of their data to ensure it is reliable enough for DPP purposes. Real-time monitoring through IoT ensures that products meet quality standards throughout their lifecycle and reduces the need for manual interventions.
Flex AI to Support Manufacturing Flow Flex uses artificial intelligence to improve production quality and efficiency in electronics manufacturing. By analyzing process data, the system can adjust test sequences and predict where quality issues might arise. This approach supports both centralized planning and decentralized execution.
Solvoyo has a metric they call the user acceptance rate. This metric measures the percentage of time the planners accept replenishment, transportation, or inventory plans as they are without any change in the timing of the delivery or the quantity to be delivered. If a user makes changes to the plan, they log that data.
Similarly, investing in renewable energy can reduce operating costs while enhancing air quality and benefiting local communities. Metrics like carbon emissions, waste diversion rates, worker safety incidents, and supplier compliance scores provide clear indicators of success and help build trust with stakeholders.
Multiple industry studies confirm that regardless of industry, revenue, or company size, poor data quality is an epidemic for marketing teams. This buyers guide will cover: Review of important terminology, metrics, and pricing models related to database management projects.
The biggest issue with CPFR was the quality of the customer forecast. Neil’s post in response to my post of Driving Value From Outside-in Planning : In her post, ‘Driving Value from Supply Chain Planning’, Lora Cecere provides great supply chain analysis and benchmarking for her supply chains to admire.
Its not replacing human judgment, but it is improving the quality and speed of that judgment. The ability to pressure-test decisions before committing real resources significantly improves response quality. Metrics must reflect the new priorities. Technologyparticularly AIis playing a central role in enabling this shift.
We’ll examine the key components of efficient supply chains, explore essential performance metrics, and uncover the fundamental drivers that influence efficiency. It’s not about finding the cheapest supplier, but the one that offers the best value considering quality, reliability, and cost.
Aera has developed something called a “data quality skill.” Not all the transactional data, just the data required to calculate a metric or make a decision. He shared the names of some of their customers on an off-the-record basis. They include some of the largest companies in the world. So, we deploy an agent on an SAP environment.
IoT sensors also track environmental conditions, ensuring product quality during transit. Set Measurable Goals: Establish clear targets for emissions reduction, energy efficiency, and sustainability metrics. Internet of Things (IoT): IoT devices monitor vehicle performance and energy usage, enabling real-time optimization.
According to my research, top-performing supply chains possess three very different qualities. A supply chain that produces products at the same cost, quality and customer service given the level of demand and supply volatility. Reward teams for cross-functional metrics. Focus functional metrics to improving reliability.
Supplier Performance: Evaluate your vendors’ reliability, quality, and delivery times. Managing raw materials effectively is also critical in this strategy to ensure product quality and efficiency at every stage of the supply chain. Analyzing performance trends helps you find areas to improve across your supply chain.
In this final blog on agility and why you should consider becoming an agilist to survive the new completion (of the continuous mention) of the application of enterprise decision management systems (EDMS) from Taylor and Raden cited in the first blog, I turn to the metric of agility and a new ROI metric of decision yield. The Takeaway.
The ability to ensure product quality is the cornerstone of a manufacturer’s success. By integrating quality into every step of the manufacturing process, companies can cut the production costs associated with rework and scrap, as well as lower the risk of recalls and potential litigation over defective products.
Protecting sensitive data—such as vehicle locations, driver information, and operational metrics—requires rigorous cybersecurity measures. Companies such as UPS, FedEx, Amazon Logistics, Summit Materials, and Sobeys demonstrate that centralized, data-driven fleet management drives down costs, enhances safety, and strengthens service quality.
Balancing increased demand with consistent quality and controlled costs is difficult but essential for manufacturers looking to expand. This requires a strategic approach focused on efficiency, quality control, and sustainable growth. Quality Control: Higher volumes create more opportunities for defects.
SCM is focused on efficiency, throughput, and resilience across a much wider operational footprint and requires coordination between manufacturing, logistics and supply chain, and demand planning teams to ensure timely fulfillment and quality assurance. on-time delivery, quality), contract compliance rate, and forecast accuracy.
A shift from functional metrics to a balanced scorecard. I like the use of growth, margin, inventory turns, Return on Invested Capital, customer service and ESG metrics. The focus on functional metrics sub-optimizes balance sheet results. Funny, isn’t it? Not Paying Attention to Process Latency.
Watermelon Metrics Don’t Drive The Right Results. I love the metaphor of watermelon metrics. In most organizations, there is a dashboard of functional metrics that shows all of the functions operating in the “Green” or acceptable levels until it comes to customer service. What are functional metrics?
A supply chain event can have a massive impact on operations and production quality and leave customers in the lurch, impacting customer satisfaction, revenue, and profits. Tracking the Metrics that Matter. Inflation Metrics. Tracking this metric and taking steps to improve it can help combat inflation. Risk Metrics.
However, one crucial caveat to all this growth and opportunity is that—you need to follow industry compliance guidelines and deliver on quality. Quality management also plays a crucial role in product development. Why do an internal quality audit?
Quality management is one of those things that you only realize the importance of when it does not work. When quality controls are on track, they improve efficiency and cost, and things hum along. But when they go awry, quality issues can drive up material and labor costs, threaten margins, and result in missed orders.
Despite goals to improve agility and resiliency, functional metrics for manufacturing efficiency continually throw the supply chain out of balance. I define agility as the organizations capabilities to have the same cost, quality, and levels of customer services given the level of demand and supply variability.) The So What?
However, the success of an ERP system largely depends on the quality of its master data. Poor quality master data can lead to errors, delays, and inconsistencies, which can have serious implications for an organization’s bottom line. These systems help organizations to manage their resources more efficiently and effectively.
For organizations layered in functional metrics and driving a cost agenda, this is a tough nut to crack. A planning master data layer measures and tracks shifts in lead times, conversion rates, and quality. Tougher than most understand. United States Inflation Rates and GDP Inflation is the highest in forty years.
Further, when they began thinking about a platform to detect and react to equipment anomalies, they realized those capabilities would support safety, better product quality, and production optimization. They realized the ROI associated with that could be massive. Al Syed elaborated.
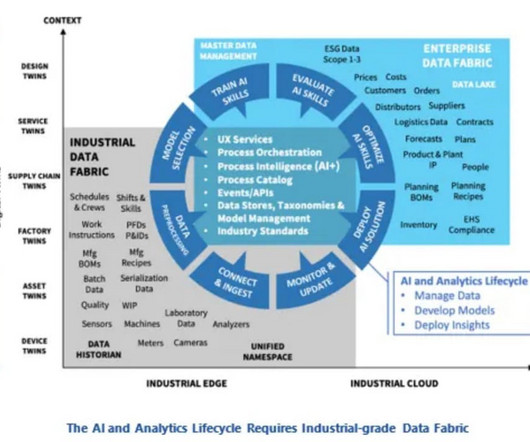
Not All Data is Created Equal Just as a gourmet meal requires the perfect quantity and quality of ingredients, your AI-powered supply chain needs the right mix of data to work its magic. Assess the quality, granularity, timeliness, and relevance of each data source to determine its suitability for AI-driven analysis.
This process takes raw data from your factory floor everything from the hum of machines to the quality checks performed by your team and turns it into actionable intelligence. Here’s a breakdown of the key data types: Production Metrics: These tell you how much you’re producing and how efficiently.
Relevant audiences are those most likely to convert into actual clients, so targeting them improves the quality of leads and ultimately boosts your business’s growth. Focus on Building Quality Connections In the competitive logistics industry, building high-quality connections online is important.
The focus is on functional metrics, but are unable to get to overall supply chain metrics. Quality data. This is a control center to mine consumer review data to control supplier part quality. Companies are drowning in data, but struggle to get insights. Warranty data. These are all great candidates for listening.
Quality Assurance: S&OP can help ensure that suppliers meet the quality standards required for new products, preventing costly recalls or product failures. Moreover, S&OP fosters a sense of shared responsibility for quality across the organization and its suppliers. Keep Reading to unlock a 50% discount code!
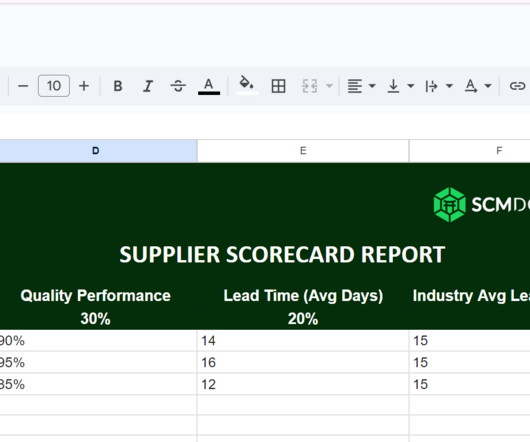
Supply chain reports are data-driven documents that provide key metrics and insights into various aspects of your supply chain, including: Inventory Levels Tracking stock levels in real-time to ensure adequate inventory to meet demand while minimizing holding costs. Cost: Pricing competitiveness, cost of quality (e.g.,
Like any intelligent system, your LMS is only as smart as the quality of content you feed it and the ability to quantify that information. The latter refers to a single variable standard (SVS), by which one metric, such as cases per hour, is expected to tell all. Every change in the routine requires another change in your SVS.
Quality-focused. Quality is key to logistics effectiveness. Focus on quality is not a bureaucracy. With the correct application of Six Sigma, an enterprise shall not forfeit modernization to maintain high quality. . Be ready to rationalize the process of Six Sigma within your organization. Process improvement.
We selected these metrics based on correlation work with Arizona State University in 2012. The winners drove long-term value (measured by market capitalization) while outperforming on the portfolio of metrics shown in Figure 1 and driving improvement faster than their peer groups. Celebrating Success. Target Setting.
By fostering these relationships, businesses can ensure stable supply chains, consistent quality, and even access to supplier innovations. Improving Cost and Quality Every decision in strategic sourcing impacts the total cost of ownership, the quality of goods or services, and supply chain resilience.
While working on this at Walmart, we created a hypothesis: if highly perishable produce is moved through a supply chain faster, it will improve the customer freshness perspective because the produce will be of a higher quality. The same “If” statement was repeated for a host of financial and operational metrics.
As the common linchpin that brings together all manufacturing activities, has this metric improved along with all the investment in new technologies? This is usually measured by improved output (for the same cost), less downtime, or as a lower cost of quality. But, what about overall workforce productivity? transformation now underway.
These systems also support phased implementation, allowing you to start with high-priority processes, train staff during regular work hours, deploy your wireless infrastructure before software rollout, maintain parallel systems during the initial transition, and closely monitor performance metrics.
Data quality — Most information is either found indirectly or self-reported by suppliers, and data are reported at various intervals, from weekly to annually. Thus, organizations must make sure that data are complete, accurate, timely, and consistent as well as capture the required metrics. Next, the enterprise can set targets.
Organizations should continuously monitor key metrics such as automation adoption rates, decision quality, and user engagement. These value-add metrics help teams assess the impact of automation while providing opportunities for continuous improvement, ensuring that the technology evolves in alignment with business needs.
For supplier sourcing and evaluation, AI-driven tools tap into historical data, market intelligence, and supplier performance metrics to automatically identify the best-fit partners. Prioritize Data Quality and Governance: AI agents rely on clean, accurate, and comprehensive data.
The trade with Asia we take for granted today was only possible by mitigating a significant supply chain trade-off – reducing costs without appreciable impacts to quality and service. AND with growing concern about climate change, trade-off considerations must account for cost, quality, service, and now sustainability.
Risks and Trade-offs Like any advanced tech initiative, digital twins come with implementation challenges: Data Quality: Garbage in, garbage out still applies. Mitigation best practices include cross-functional pilots, strong executive sponsorship, and early wins tracked with business metrics.
We organize all of the trending information in your field so you don't have to. Join 102,000+ users and stay up to date on the latest articles your peers are reading.
You know about us, now we want to get to know you!
Let's personalize your content
Let's get even more personalized
We recognize your account from another site in our network, please click 'Send Email' below to continue with verifying your account and setting a password.


Let's personalize your content