This site uses cookies to improve your experience. To help us insure we adhere to various privacy regulations, please select your country/region of residence. If you do not select a country, we will assume you are from the United States. Select your Cookie Settings or view our Privacy Policy and Terms of Use.
Cookie Settings
Cookies and similar technologies are used on this website for proper function of the website, for tracking performance analytics and for marketing purposes. We and some of our third-party providers may use cookie data for various purposes. Please review the cookie settings below and choose your preference.
Used for the proper function of the website
Used for monitoring website traffic and interactions
Cookie Settings
Cookies and similar technologies are used on this website for proper function of the website, for tracking performance analytics and for marketing purposes. We and some of our third-party providers may use cookie data for various purposes. Please review the cookie settings below and choose your preference.
Strictly Necessary: Used for the proper function of the website
Performance/Analytics: Used for monitoring website traffic and interactions
For example, if I improve the cost structure in transportation, procurement, manufacturing and sales independently, what decision support framework decides the right trade-offs? In today’s architectures and functional metrics, value optimization does not exist. Align functional metrics to reliability to deliver value.
Spend analysis is often the entry point. This blog offers a clear, practical overview of what spend analysis is, how it supports strategic sourcing, and why it matters for both direct and indirect procurement. Schedule a demo of Ivalua’s Spend Analysis solution today! Let’s dig in!
Think about the building of listening posts of rating & review data, continuous listening of call center transcripts, analysis of contracts, or the continuous analysis of supplier certificates for digital passport/Scope 3 emissions. Did you know that improvement in the supply chain drives 50-70% of this value metric?
However, as carbon taxes and emissions reporting requirements continue increasing, supply chain professionals face mounting pressures from inside and outside their organizations to measure and improve performance against new, nebulous sustainability metrics. Freight transportation makes up over 10% of total global carbon emissions.
This is amplified across the supply chain into an exponential impact on inventory and planned orders for manufacturing. When we measure the bullwhip impact (in my class on outside-in process thinking), the bullwhip between manufacturing and procurement is 2-3X. Hire a consultant to do the analysis. The difference is opportunity.
For companies that want to go beyond the traditional spreadsheet, which cannot handle this ocean of information efficiently, statistical methods such as cluster analysis can help. What is Cluster Analysis? Cluster analysis is a statistical umbrella term for methods that classify data points according to their attributes.
Functional Metrics and the Lack of Alignment to Strategy. Process-based companies continue to focus on manufacturing efficiency (OEE) and discrete on procurement (PPV) without designing the supply chain to balance transportation, manufacturing, and procurement to a balanced scorecard. The Lovefest with Shiny Objects. Guess what?
Scaling manufacturing operations is crucial for business growth but presents unique challenges. Balancing increased demand with consistent quality and controlled costs is difficult but essential for manufacturers looking to expand. Successfully scaling manufacturing requires more than just adding resources.
The research methodology for the Supply Chains to Admire compares the performance of a company against its industry peer group for the metrics of Year-over-Year Revenue Growth, Inventory Turns, Operating Margin, and Return on Capital Employed (ROCE). For 80% of industries, the supply chain metrics represent more than 40% impact on value.
At each company, there is a relationship between the metrics of growth, margin, inventory, customer service, and asset strategy. For the purpose of this article, I will use Return on Invested Capital (ROIC) as the proxy metric to discuss asset utilization.) Supply chain excellence was largely defined as manufacturing excellence.
billion rate data points monthly to provide the most comprehensive view of the market, helping you identify savings opportunities and make data-driven decisions. billion rate data points monthly to provide the most comprehensive view of the market, helping you identify savings opportunities and make data-driven decisions.
Planners are uniquely positioned with an end-to-end focus, from procurement of materials, through manufacturing and engineering, to the movement, storage, and delivery of finished products or services. The ARC Advisory Group will soon begin updating the annual Supply Chain Planning Market Analysis.
If you answer the survey, I will gladly give you a custom analysis of your organization against the peer group. In the supply chain team analysis, note the 21% gap between procurement and manufacturing teams, the 35% gap between sales and operations and the 21% gap between finance and operations. Functional Metrics.
That’s the power of manufacturing data collection. Manufacturing data collection is your secret weapon for boosting efficiency, cutting waste, and staying ahead of the competition. Manufacturing data collection is your secret weapon for boosting efficiency, cutting waste, and staying ahead of the competition.
My goal is to convince you to ground supply chain processes and technology implementations in data analysis while tying the results to the improvement in corporate performance. The first story is about a large regional food manufacturer. The second story is about a regional beverage manufacturer. What do I mean by science?
We consistently see that companies focused on functional excellence–a focus within a functional silo like manufacturing, transportation or distribution– or singular metrics– like inventory or costs– underperform against their peer groups. Reward teams for cross-functional metrics. Cost-to-Serve Analysis.
For my long-time readers, you know that fewer than 3% of companies outperform their peer group in our Supply Chains to Admire analysis , and that the Gartner Top 25 is essentially a beauty contest for underperformers. But, as the dust settles, is there value? And what is value? Supply chain leaders love bright and shiny objects.
The formula for OTIF is: Measuring a supply chain against OTIF metrics is a key strategy that helps decision makers attach a tangible value to the success of their fulfillment and allows them to determine key strategies. The ability to meet fulfillment goals is impeded by several issues.
Need For What-If Analysis. Advanced planning evolved with a focus on modeling manufacturing constraints. Watermelon Metrics Don’t Drive The Right Results. I love the metaphor of watermelon metrics. What are functional metrics? Out of desperation, they turned to the use of descriptive analytics.
Frank, the line manager for manufacturing, dominated the meetings. Despite goals to improve agility and resiliency, functional metrics for manufacturing efficiency continually throw the supply chain out of balance. Strong manufacturing organizations do not make the most effective manufacturers.
For a more detailed analysis, check out the Power point summary.) Nvidia, Northrup Grumman, PACCAR Inc, PCA (Packaging Corporation of America), ResMed, Rockwell Automation, Ross Stores, Taiwan Semiconductor Manufacturing (TSMC) Company, Tempur-Pedic, TJX, Toro, Toyota, West Pharma, United Tractors, and Urban Outfitters. be careful.
For organizations layered in functional metrics and driving a cost agenda, this is a tough nut to crack. I don’t care what you call it, but network design, what-if analysis, simulation and digital twin approaches grow in importance.) Tougher than most understand. Steps to Take Here are three steps to take: Adaptive Modeling.
IoT sensors monitor various parameters like temperature, humidity, and equipment status, providing valuable data for analysis and predictive maintenance. Which warehouse performance metrics should be tracked? The post 8 Warehouse Optimization Tips from Manufacturing Experts appeared first on RFgen.
billion rate data points monthly to provide the most comprehensive view of the market, helping you identify savings opportunities and make data-driven decisions. billion rate data points monthly to provide the most comprehensive view of the market, helping you identify savings opportunities and make data-driven decisions.
In the automotive sector, manufacturers are simultaneously reducing inventory costs and delivery times. We’ll examine the key components of efficient supply chains, explore essential performance metrics, and uncover the fundamental drivers that influence efficiency.
In manufacturing, performance improvement, cost reduction and process optimization are crucial. Manufacturers have adopted innovative solutions and technologies to deal with these issues. There is no question that AI and ML will have important roles in shaping the future of manufacturing ERP. What is AI and ML?
The widespread supply chain disruptions that happened when the global pandemic hit in 2020 highlighted several important lessons regarding manufacturing and supply chain visibility. Powered by the 3DEXPERIENCE platform, DELMIA takes a model-based, data-driven approach by connecting the virtual and real worlds of manufacturing and operations.
It is now our fifth year of analyzing balance sheets to understand which companies are outperforming their peer groups on the metrics of growth, operating margin, inventory turns and Return on Invested Capital (ROIC) while driving improvement. It takes us three months and two full-time research assistants to finish the analysis.
I worked three layers down in the organization for a well-established leader in manufacturing named Dan. Dan had a very manufacturing view and Fred focused on logistics. The analysis, based on network optimization assumed average loading, and did not account for the swings. The metrics were not aligned. You have to do so.
In a survey of 150 global manufacturing executives, 47% committed to improving supply chain visibility and tracking. Supply chain visibility often means “where’s my stuff,” or the ability to trace parts in transit from the manufacturer to the final destination. What is supply chain visibility?
The award, based on beating the industry peer group on rate of improvement on the key metrics of growth, operating margin, inventory turns, and Return on Invested Capital (ROIC) while outperforming their peer group, is tough to achieve. We complete the analysis each year. In this analysis, patterns matter.
There are three reasons why: Vertical excellence—having the best manufacturing, procurement or transportation function—has not worked. Aligned Metrics. What percentage of retail out-of-stocks could be prevented by the manufacturer in these industries? Can you help us with what you see in the data?” ” Yes, I said.
Contract manufacturing or 3PL data often will have a 24-hour latency due to batch integration. When they built the project, they did not realize that they did not have access to daily data daily for their third-party warehouses and contract manufacturing locations. Example of Social Sentiment Analysis. 2) Latency. Master data.
IBP is long-range strategic business planning that combines volumetric and financial data into a single, highly visual, comprehensive planning platform that delivers greater global visibility, more powerful multi-scenario analysis over longer planning horizons, tighter collaborative workflows, and a wider spectrum of alerts.
That means identifying areas of waste, overlap and large volumes and enabling continuous improvement through the use of transportation metrics to track performance. Using an offshore vendor to manufacture a component for a larger automotive assembly is a typical example.
The ability to ensure product quality is the cornerstone of a manufacturer’s success. By integrating quality into every step of the manufacturing process, companies can cut the production costs associated with rework and scrap, as well as lower the risk of recalls and potential litigation over defective products.
Closing the gaps happens when there are aligned metrics, clarity of vision and aligned planning processes. More advanced supply chain leaders model the role of complexity (product and customer), the impact of risk, and opportunity of innovation as well as product shipping and manufacturing locations, and inventory policies.
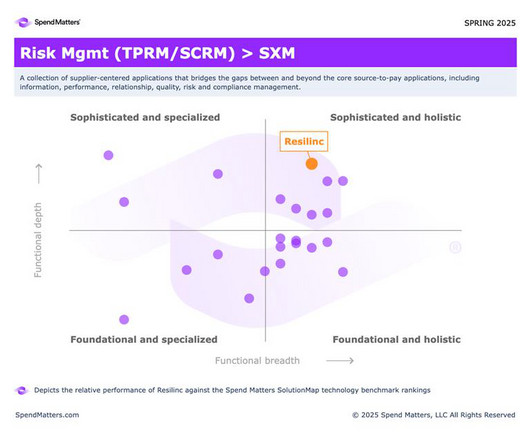
Where Resilincs Supply Chain Technology Excels Spend Matters’ independent analysis provides valuable insights into our platform’s capabilities. The Numbers That Matter One metric from the Spend Matters analysis stands out above all others: our 9.0 customer satisfaction score.
Based on the work with Georgia Tech, we are getting clear on which metrics matter by industry. As companies adopt a balanced scorecard, the functional metrics shift to a focus on reliability. For example, in manufacturing, the shift in focus is away from OEE to focus on first pass yield and schedule adherence.)
I have learned that supply chain systems are more complex than I originally thought, and that the relationships between supply chain metrics are nonlinear. I have also learned that you need a large data pool to derive the type of analysis that I want to publish. The greatest gap is in the design of supplier and manufacturing networks.
Keeping track of all your moving parts in manufacturing is a tall order. That’s where manufacturing inventory management software comes in. In this ultimate guide, we’ll break down everything you need to know about manufacturing inventory management software. Spreadsheets just don’t cut it anymore.
These are mainly North American-based manufacturers, distributors and retailers.) We loaded 493 financial metrics from balance sheets and income statements for each company into the data lake for the period of 2004-2016 using YCharts data. The analysis was industry-specific. Shown in Figure 1 is an example of resiliency.
Optimization engines to improve functional metric performance resulted in an exploding number of planners. Contract Manufacturing Signal Latency. In my last blog post, I shared insights on data synchronization between brand owners and contract manufacturing. On average, it takes 2.8 Armed with this insight, start the discussion.
We organize all of the trending information in your field so you don't have to. Join 102,000+ users and stay up to date on the latest articles your peers are reading.
You know about us, now we want to get to know you!
Let's personalize your content
Let's get even more personalized
We recognize your account from another site in our network, please click 'Send Email' below to continue with verifying your account and setting a password.


Let's personalize your content