This site uses cookies to improve your experience. To help us insure we adhere to various privacy regulations, please select your country/region of residence. If you do not select a country, we will assume you are from the United States. Select your Cookie Settings or view our Privacy Policy and Terms of Use.
Cookie Settings
Cookies and similar technologies are used on this website for proper function of the website, for tracking performance analytics and for marketing purposes. We and some of our third-party providers may use cookie data for various purposes. Please review the cookie settings below and choose your preference.
Used for the proper function of the website
Used for monitoring website traffic and interactions
Cookie Settings
Cookies and similar technologies are used on this website for proper function of the website, for tracking performance analytics and for marketing purposes. We and some of our third-party providers may use cookie data for various purposes. Please review the cookie settings below and choose your preference.
Strictly Necessary: Used for the proper function of the website
Performance/Analytics: Used for monitoring website traffic and interactions
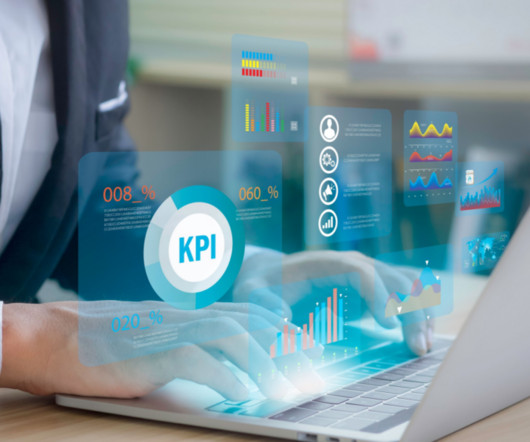
In today’s architectures and functional metrics, value optimization does not exist. And, when procurement and tactical planning operate in isolation, there is no decision support framework to guide the trade-offs especially when the functions are tethered to different and conflicting metrics. You are right.
In follow-up qualitative interviews, one of the largest issues with organizational alignment was metric definition and a clear definition of supply chain excellence. In my post Mea Culpa, I reference my work with the Gartner Supply Chain Hierarchy of Metrics. Error is error, but is it the most important metric? My answer is no.
Creating a data-driven supply chain tracking important transportation metrics helps shippers respond and adapt as quickly as possible to known and unknown events. Why Monitor Transportation Metrics. Transportation metrics provide visibility that helps drive operative and competitive advantages.
Mondays are my day to post my Shaman blog and compose a podcast. The Shaman blog is now over eleven years old. Over 28,000 readers read this blog. Use of Supply Chain Descriptors Most organizations are locked into functional silos driven by functional metrics. I remember my first post like it was yesterday. I give thanks.
Learn how to combine very different metrics/KPIs towards a composite score, this is a question that comes up quite often in my conversations with customers. How to Combine Diverse Supply Chain Metrics was first posted on May 4, 2021 at 10:54 am.
In this blog, I also make the argument that if you follow the Gartner Magic Quadrant direction, you may decrease the value of the firm. For 80% of industries, the supply chain metrics represent more than 40% impact on value. Today, companies measure too many metrics without a clear definition of value. The market lacks a leader.
April 23, 2025 Blog Today, we’re excited to announce the launch of Freightos Enterprise our comprehensive solution designed specifically for large enterprises that import and export, who need to bring control, visibility, and efficiency to their global logistics operations.
In this final blog on agility and why you should consider becoming an agilist to survive the new completion (of the continuous mention) of the application of enterprise decision management systems (EDMS) from Taylor and Raden cited in the first blog, I turn to the metric of agility and a new ROI metric of decision yield.
I am currently working on a couple of case studies for this blog on how business leaders used digital twin modeling during the pandemic. Watermelon Metrics Don’t Drive The Right Results. I love the metaphor of watermelon metrics. What are functional metrics? It Is Even Worse in the Pandemic. Customer service is red.
The month of December was my longest writing respite since I started this blog in January 2010. Posting the first blog seems like yesterday, but thirteen years and over 540 blogs later, taking a pause from a weekly deadline was badly needed. Today is a writing day. My last post was December 7th, 2023.
How do we design work systems to align organizations and ensure that there is the right balance of reward systems with metrics? Is there a need to redesign metrics to move from a functional and traditional function to drive goal alignment? In the design of the digital program, spend time on metrics and reward systems.
This was the case for the client stories that I will share in this blog. It is my hope that we can side-step political discussions demonstrated in my stories and ground the problem solving in scientific methods to understand the properties of data, the potential of supply chains through modeling, and the alignment of metrics.
April 23, 2025 Blog Today, we’re excited to announce the launch of Freightos Enterprise our comprehensive solution designed specifically for large enterprises that import and export, who need to bring control, visibility, and efficiency to their global logistics operations.
As a result, the metrics have to be viewed together as a pattern over time. In the journey, the supply chain leader needs to improve the potential of a portfolio of metrics. The metrics of growth, Return on Invested Capital, Inventory Turns and Operating Margin have the highest correlation to market capitalization.
Conduct Comprehensive Financial Analysis Demonstrate tangible ROI by highlighting: Projected revenue improvements Cost savings Return on investment metrics Performance during market volatility Real-world data shows probabilistic forecasting can improve forecast accuracy by 15-25% compared to traditional methods.
I often write my blogs in my head as I swim. One of my stark realizations this year is that smaller companies are beating larger and often more established companies on growth metrics, inventory turns, operating margin, and Return on Invested Capital (ROIC). (In A focus on functional metrics degrades balance sheet performance.
This blog will review how category managers and supply planners can use cluster analysis to make smarter decisions and grow sales. Price index and price elasticity are useful metrics on their own, and a combination of these can help determine the right price point to maximize revenue and profit. The retail industry is rich with data.
I will write more on this in my next blog post.). In this blog, I hope that I push you too. In addition, I am now done with the page proofs for my new book, Metrics that Matter. Instead, he wants to drive supply chain excellence and build the metrics that matter. These new technologies are evolving. (I
In this blog, we cover the key differences between procurement and supply chain management, and explain where the biggest disconnects typically occur. While procurement operates as a function within the broader supply chain, it has its own set of priorities for strategic sourcing in procurement, performance metrics, and specialized processes.
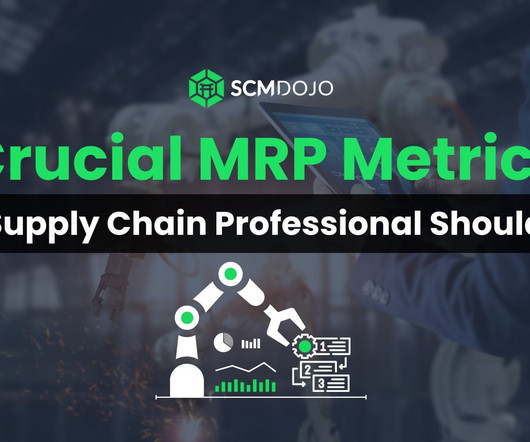
This blog explains The Key MRP Metrics in Supply Chain whcih every supply chain professional in Manufacturing or Distribution Businesses. The metrics that underpin MRP could be described as the balls in this juggling act. This article takes an in-depth look at the crucial metrics every supply chain professional needs to know.
Retailers implementing these solutions are seeing improvements in customer engagement metrics and repeat purchase rates. Agent AI is emerging as a game-changing tool for understanding and responding to customer behavior in real-time.
I try to post weekly on this blog. Optimization engines to improve functional metric performance resulted in an exploding number of planners. In my last blog post, I shared insights on data synchronization between brand owners and contract manufacturing. He wants answers. Fair enough I say… I do as well. Take the plunge.
Some of the packages on the trucks moving right now are the first shipments of Metrics that Matter. So, if your doorbell rings, with your copy of Metrics that Matter, think about the importance of logistics this holiday season. Have a great holiday and thanks for being a loyal reader of the Supply Chain Shaman blog.
The formula for OTIF is: Measuring a supply chain against OTIF metrics is a key strategy that helps decision makers attach a tangible value to the success of their fulfillment and allows them to determine key strategies. The ability to meet fulfillment goals is impeded by several issues.
Happy Valentine’s Day to all my blog readers. This is my 440th blog post and the tenth anniversary Supply Chain Shaman. Most supply chain leaders cannot get their groove on because they generalize–the use of the same metric targets and tactics for the supply chain without paying attention to the flows. Wrong Metrics.
Companies moving to BPO in these practice areas are experiencing supply chain improvements in metrics such as inventory turnover and customer service. Metrics – BPO vendors can also help firms utilize performance metrics and KPIs to help monitor performance and help to identify ways to improve it. versus $4.84 For example ….
Let’s explore nine in this blog. We speak about the need to move from a functional understanding to a global, holistic capabilities, but the traditional supply chain leader defines bonus incentives and process performance goals based on functional metrics. Art of the Possible. technologies. Measurement.
The traditional metrics of excellence cost efficiency, on-time delivery while still important, are no longer sufficient in an era defined by volatility, complexity and political changes. The stakes are high, in previous blog posts New Tariffs Are Coming and The Pressures of Omni-Channel Fulfillment and Returns Are Growing.
In part 1 of my blog on Planning the Value Chain and Decision Making in Times of Disruption, the focus was on the ability to react and execute amidst the unpredictability of demand. Ultimately, what KPIs, as metrics and indicators derived from the set of plans are taken into account and prepared for each scenario.
In this blog post, I give a framework to drive discussions. The focus is on functional metrics, but are unable to get to overall supply chain metrics. Business Use Cases. There is no class of technologies, or common definition, for “control towers.” Instead, a project needs to be based on user-defined set of capabilities.
In this blog post, we’ll explore the challenges of inventory management in today’s manufacturing landscape , discuss the importance of a “single source of truth” for global inventory, and introduce a powerful solution that can help manufacturers transform their operations and drive profitability. How do they achieve this?
Th is blog post covers the critical ways strategic partnerships can help supply chain managers achieve optimal OTR management for their freight. Focusing on the transportation metrics that have the greatest impact on the supply chain can help managers stay attentive to both short-term and long-term goals and needs. .
Note to the reader: we selected these metrics for the balanced scorecard for the analysis after work with Arizona State University to understand which metrics, in combination, most closely correlated with market capitalization. Consider the role of functional metrics and the lack of alignment with the corporate scorecard.)
In this blog, you’ll learn what AI agents are, how they differ from traditional procurement software, where they deliver real-world impact, and how to overcome adoption challenges. Check out our blog, “ Transforming Procurement with Generative AI: A Practical Approach ” to learn more.
However, AI-powered demand forecasting software like ToolsGroup has transformed this process by incorporating early indicators from diverse data sources: Web analytics and search trends Product attribute similarities to existing items Social media engagement and sentiment analysis Competitive product performance data Early order patterns and consumer (..)
A collaborative dedicated provider can deliver on critical service metrics and adjust to demand changes, while helping eliminate unfavorable market exposure.” Around-the-clock, anywhere access empowers global operations with advanced metrics and data.
According to Gartner , early stages of S&OP maturity often lack formal processes, metrics, and cross-functional participation. Most S&OP efforts break down due to disconnected systems, siloed data, and a lack of cross-functional engagement.
This blog breaks down what retailer scorecards are, what they measure (including OTIF), how they vary by retailer, and how you can improve your performance to avoid costly penalties. One of the most important metrics on a retailer scorecard is OTIF , which stands for On Time, In Full. What Is a Retailer Scorecard?
Unlike most of the KPIs we recommend, perfect order is a composite of several elementary metrics. Damage-free delivery: This measurement is sometimes incorporated into the in full KPI, but can just also be a stand-alone metric. What about DIFOT?
If the company I wanted to order a green sweater for my father considered the importance of keeping an optimized inventory considering their promotion, my sole reason for writing this blog would not exist.
This blog explores how MTSS platforms can be strategically utilized to build the competencies necessary for success in supply chain management. Courses and modules focused on data analytics, forecasting, and performance metrics equip students with the skills needed to leverage data in optimizing supply chain operations.
We organize all of the trending information in your field so you don't have to. Join 102,000+ users and stay up to date on the latest articles your peers are reading.
You know about us, now we want to get to know you!
Let's personalize your content
Let's get even more personalized
We recognize your account from another site in our network, please click 'Send Email' below to continue with verifying your account and setting a password.


Let's personalize your content