This site uses cookies to improve your experience. To help us insure we adhere to various privacy regulations, please select your country/region of residence. If you do not select a country, we will assume you are from the United States. Select your Cookie Settings or view our Privacy Policy and Terms of Use.
Cookie Settings
Cookies and similar technologies are used on this website for proper function of the website, for tracking performance analytics and for marketing purposes. We and some of our third-party providers may use cookie data for various purposes. Please review the cookie settings below and choose your preference.
Used for the proper function of the website
Used for monitoring website traffic and interactions
Cookie Settings
Cookies and similar technologies are used on this website for proper function of the website, for tracking performance analytics and for marketing purposes. We and some of our third-party providers may use cookie data for various purposes. Please review the cookie settings below and choose your preference.
Strictly Necessary: Used for the proper function of the website
Performance/Analytics: Used for monitoring website traffic and interactions
As supply chains become more impacted by market disruptions and unpredictable events, they’re also becoming more critical to a company’s customer experience levels and bottom line. Creating a data-driven supply chain tracking important transportation metrics helps shippers respond and adapt as quickly as possible to known and unknown events.
On December 5th, Supply Chain Insights is hosting a small event at Georgia Tech to share the results of a two-year research effort to connect financial metrics by industry to supply chain performance to drive value. Did you know that improvement in the supply chain drives 50-70% of this value metric?
This is part two of the Top 10 Metrics to Track and Manage Risk in the Supply Chain article. Weather-related events occur, and public health scares always seem present. The post Top 10 Metrics to Track and Manage Risk in the Supply Chain – Part 2 appeared first on Transportation Management Company | Cerasis.
A disruption at any point in the global logistics network including the average of 12 touch points from shipment packaging to final delivery can prove disastrous for profits, service levels, customer loyalty, and other key metrics. With the global e-commerce market predicted to reach $8.1 billion to $23.07
Timestamps (00:00:04) A Trillion Dollars in Freight Transactions (00:00:16) Guest Background (00:00:50) DAT Freight Marketplace (00:01:36) DAT Analytics for Brokers and Carriers (00:06:31) Economies of Scale for Shippers (00:09:17) FedEx Exec on Logistics Puzzle (00:11:59) Industry Partnerships (00:16:41) Trillion Dollars in Freight Transactions (00:20:32) (..)
billion rate data points monthly to provide the most comprehensive view of the market, helping you identify savings opportunities and make data-driven decisions.
Enhanced Promotions and Events Analysis Promotions, advertising campaigns, and trade events are vital components of marketing strategy, but accurately measuring their impact on demand remains challenging. Five Ways Advanced Machine Learning in Demand Planning Is Improving Forecasting 1.
We talk about the move from functional metrics to a balanced scorecard, but we don’t use a balanced scorecard as an objective function. Today, several factors make it hard to wrestle truth from opinion: Event Models with a Focus on Sponsorship. Most events are designed to help technologists generate leads.
Using balance sheet data from 2011 to 2019, we chart companies’ progress by peer group on rate of improvement and performance in the metrics of growth, operating margin, inventory turns, and Return on Invested Capital (ROIC). A focus on functional metrics throws the supply chain out of balance.)
We selected these metrics based on correlation work with Arizona State University in 2012. The winners drove long-term value (measured by market capitalization) while outperforming on the portfolio of metrics shown in Figure 1 and driving improvement faster than their peer groups. Celebrating Success. Target Setting. What is different?
The formula for OTIF is: Measuring a supply chain against OTIF metrics is a key strategy that helps decision makers attach a tangible value to the success of their fulfillment and allows them to determine key strategies. The ability to meet fulfillment goals is impeded by several issues.
The industry is awash with ex-execs advising companies, speaking at events, and consulting. Yet, you will find the past executives from Sanofi speak openly on event stages about their journey on supply chain excellence as winning performance. The group’s response is, “Are these supply chain metrics?”
Watermelon Metrics Don’t Drive The Right Results. I love the metaphor of watermelon metrics. In most organizations, there is a dashboard of functional metrics that shows all of the functions operating in the “Green” or acceptable levels until it comes to customer service. What are functional metrics?
Here are the key insights we gathered firsthand at this year’s event. Retailers implementing these solutions are seeing improvements in customer engagement metrics and repeat purchase rates. Agent AI is emerging as a game-changing tool for understanding and responding to customer behavior in real-time.
A supply chain event can have a massive impact on operations and production quality and leave customers in the lurch, impacting customer satisfaction, revenue, and profits. Tracking the Metrics that Matter. Inflation Metrics. Tracking this metric and taking steps to improve it can help combat inflation. Risk Metrics.
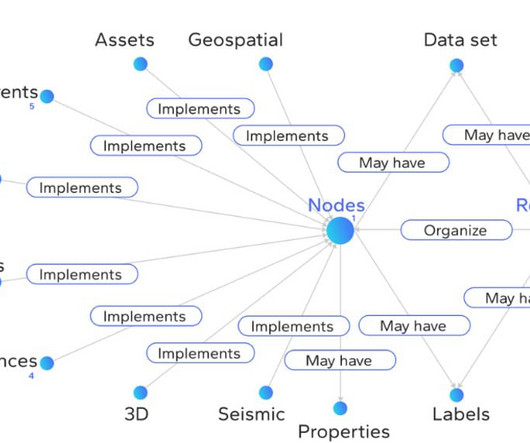
The occurrence of any of these events disrupts the global supply chain and can deeply impact profitability. One event could create so much churn, Mr. Al Syed explained. can require accessing many pieces of siloed data and then looking for relationships between the data sets and an event that has occurred. is the user interface.
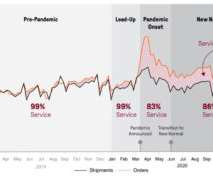
They can then use the data to provide an apples-to-apples benchmark on a variety of innovative supply chain metrics applicable to the grocery supply chain. These extreme error events “are the supply chain equivalent of the highway washout or bridge closure.” During the pandemic, extreme error events rose to 38%.
billion rate data points monthly to provide the most comprehensive view of the market, helping you identify savings opportunities and make data-driven decisions.
Event companies perpetuate the myths of best practices. The industry has too many events. The events funded by sponsorships not a quest for the truth. The events funded by sponsorships not a quest for the truth. In the last decade, each party—consultants, technologists and event companies– have made a lot of money.
One of my stark realizations this year is that smaller companies are beating larger and often more established companies on growth metrics, inventory turns, operating margin, and Return on Invested Capital (ROIC). (In The metrics selection resulted from work with Arizona State University in 2013.) Look for the full report next week.).
Companies with the lower score on the Index are driving faster rates of metrics improvement. Energizer and Unilever are driving the fastest rates of improvement and Clorox and P&G improvement rates are the slowest on the Metrics That Matter of Growth, Operating Margin, Inventory Turns, and Return on Invested Capital (ROIC)).
Black Swan events are expected to come at shrinking intervals, so organizations must think about where disruption will come from and how it will affect global supply chains. The post Two-Thirds of Organizations Say Reducing Supply Chain Disruption Has Increased in Priority in Response to Recurring Black-Swan Events appeared first on Ivalua.
Internal Perspective: Performance Monitoring: KPIs and Metrics: Establish key performance indicators (KPIs) to monitor distributor performance. Track metrics such as sales volume, market share, inventory levels, and customer satisfaction. Make sure that you monitor this and measure performance against agreed targets. They just won’t.
This week, as the east coast of the United States was deluged with rain, I basked in beautiful San Diego sun while attending the Logimed USA event. This was WBR’s first event in the United States targeted for the Medical Device Supply Chain Leader. I had not been to a medical device event and I wanted to listen.
Not only do you need to be able to know the full impact of events and decisions across your supply chain, you need to be able to shift plans seamlessly to maintain responsiveness. And then decisions on these questions will in turn affect other customers in your rattled supply chain. Agility to act on transparency.
We do not undertake or accept any obligation or undertaking to release publicly any updates or revisions to any forward-looking statements to reflect any change in our expectations or any change in events, conditions or circumstances on which any such statement is based, except as required by law.
During the company’s Velocity event held in Chicago last week, McCandless emphasized this strategic direction: “In the past ten years, project44 has built the foundation necessary for today’s AI advancements. This extensive connectivity has resulted in impressive metrics: 1.2 A key differentiator is Movement’s approach to data quality.
This event offered a unique opportunity to engage with industry leaders and gain firsthand insights into the latest trends and innovations in supply chain planning. Planning Processes and Metrics : Attendees delved into optimizing core planning processes and metrics to support strategic business performance. 3 4 in Denver, CO.
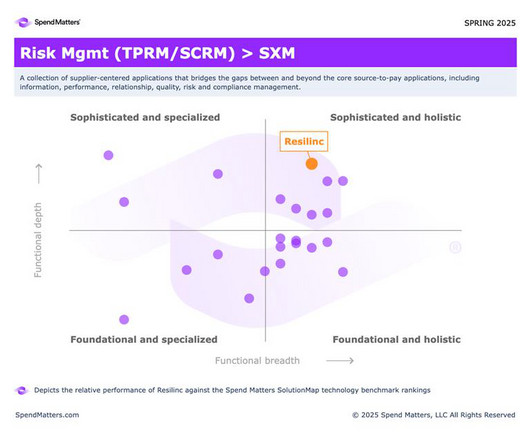
The Numbers That Matter One metric from the Spend Matters analysis stands out above all others: our 9.0 This metric matters most because it reflects real-world results and relationships, not just technical capabilities. customer satisfaction score.
Snow fell last night as I worked on my last Supply Chain Metrics That Matter report. The concept of the Effective Frontier is that best in class companies align functional metrics to balance growth, cost, inventory and Return on Invested Capital (ROIC) performance while balancing customer service metrics. The Effective Frontier.
Collaborative discussions can help identify relevant data sources and metrics that capture the end-to-end supply chain process and align with overall business goals. market data, weather forecasts, geopolitical factors, events), and IoT devices (e.g., ERP, CRM, SCM), external sources (e.g., sensors, RFID tags).
The traditional metrics of excellence cost efficiency, on-time delivery while still important, are no longer sufficient in an era defined by volatility, complexity and political changes. If you are attending ICON 2025, a premier event for supply chain professionals, please explore the session catalog.
Leadership Transition and Strategic Continuity Eddie Capel, Chairman of the Board Eddie Capel, Chairman of the Board opened the event by reaffirming Manhattan Associates ongoing focus on innovation, partnership, and adaptability. The initiative was supported by partners including Manhattan Associates, Summit Advisory Services, and others.
In our recap, we’ll dive into the key takeaways from the event and what they mean for the industry. The symposium emphasized the importance of data management to track ESG metrics and ensure compliance with regulations. We hope you had a fantastic time and look forward to hosting more events and expert panels throughout the year.
Last Year’s Black Swan Event Felt Like a Flock of Black Swans. It took a Black Swan event and the resulting unprecedented demand roller coaster to provide the urgency needed for an invitation to the top floor. Supply chain professionals are wrestling with many questions as we emerge from the year of the pandemic. Never waste a crisis.
The twin enabled dispatchers to model different delivery schedules and reroute in near real timeresulting in a double digit reduction in missed deliveries during severe weather events. Mitigation best practices include cross-functional pilots, strong executive sponsorship, and early wins tracked with business metrics.
Focusing on the transportation metrics that have the greatest impact on the supply chain can help managers stay attentive to both short-term and long-term goals and needs. . Descriptive analytics focuses on utilizing historical data to understand events that transpired and what happened within the network over a set period.
The Rise of the Self-Healing Supply Chain Today’s supply chains are under more pressure, navigating considerable hurdles such as macroeconomic instability, shifting demand patterns, climate events, and geopolitical friction. But to manage it all, supply chain professionals need action, not another dashboard.
The past two years of volatility have many logistics leaders evolving from an annual Request for Proposal or freight (RFP) event to quarterly or more frequently to accommodate the changing supply chain landscape. Given these disruptions, supply chain resiliency will be a critical factor in ensuring the success of your network.
The selection of metrics is based on prior work with Arizona State University to understand which metrics, in combination, correlate to market capitalization and price to book value. The event is designed for extreme networking. The event has no sponsorships and no technologist or consultant sales teams.
Agility can also reflect a company’s ability to effectively deal with unexpected constraints caused by strikes, earthquakes, political strife, and a variety of other events. A planner could ask the SCP engine to achieve 95% service, with CO2 emissions under a million metric tons at a given factory in the coming month.
Maintaining all past and future promotional events in a database. Maintaining outlier events that have influenced demand patterns or supply availability . Customer Satisfaction scores side by side with the service level and availability metrics. Modeling the impact of weather events. Having accurate stock-out data.
Many-to-many can also refer to many participants in a network accessing many, many sources of event data critical to supply chain operations through a public cloud network. But, if a company wants to work with a new supplier, and that supplier is in the network, metrics on that carrier also exist.
We organize all of the trending information in your field so you don't have to. Join 102,000+ users and stay up to date on the latest articles your peers are reading.
You know about us, now we want to get to know you!
Let's personalize your content
Let's get even more personalized
We recognize your account from another site in our network, please click 'Send Email' below to continue with verifying your account and setting a password.


Let's personalize your content