This site uses cookies to improve your experience. To help us insure we adhere to various privacy regulations, please select your country/region of residence. If you do not select a country, we will assume you are from the United States. Select your Cookie Settings or view our Privacy Policy and Terms of Use.
Cookie Settings
Cookies and similar technologies are used on this website for proper function of the website, for tracking performance analytics and for marketing purposes. We and some of our third-party providers may use cookie data for various purposes. Please review the cookie settings below and choose your preference.
Used for the proper function of the website
Used for monitoring website traffic and interactions
Cookie Settings
Cookies and similar technologies are used on this website for proper function of the website, for tracking performance analytics and for marketing purposes. We and some of our third-party providers may use cookie data for various purposes. Please review the cookie settings below and choose your preference.
Strictly Necessary: Used for the proper function of the website
Performance/Analytics: Used for monitoring website traffic and interactions
In today’s architectures and functional metrics, value optimization does not exist. And, when procurement and tactical planning operate in isolation, there is no decision support framework to guide the trade-offs especially when the functions are tethered to different and conflicting metrics. You are right.
In 2016, we finished a study on continuous improvement. In the study, when we asked for the top elements of business pain to drive continuous improvement for companies greater than 5B$ in annual revenue, as shown in Figure 1, we found the largest issues with cross-functional alignment and availability of talent.
This uncertainty makes dynamic inventory replenishment optimization essential for business success. Effective inventory optimization directly impacts customer satisfaction, loyalty, operational costs, and waste reduction making it a critical business function in todays volatile market.
The award, based on beating the industry peer group on rate of improvement on the key metrics of growth, operating margin, inventory turns, and Return on Invested Capital (ROIC) while outperforming their peer group, is tough to achieve. The orbit chart below illustrates L’Oréal’s performance at the intersection of two metrics.
Reason #6 Not effectively managing inventory. Reason #9 Relentless pursuit of one supply chain metric at the expense of other metrics. Social studies? Yet, these are similar instructions as what is passed down to the supply chain from executives focused on a specific supply chain metric. Don’t care.
Case Studies. A Case Study. This case study will show you the analysis of Apple Supply Chain core processes, challenging issues and complexities of its operations. Information about Apple Supply Chain is a bit here, there and everywhere, its kinda tough to find the actual case study. Inventory Turnover.
If you would like to participate in a current research study, we would love your help and participation in the contract manufacturing study. Use of Supply Chain Descriptors Most organizations are locked into functional silos driven by functional metrics. The metrics defining success in manufacturing and procurement do not align.
A disruption at any point in the global logistics network including the average of 12 touch points from shipment packaging to final delivery can prove disastrous for profits, service levels, customer loyalty, and other key metrics. With the global e-commerce market predicted to reach $8.1
trillion distortion inventory problem. Trillion Inventory Distortion Problem In this podcast, Karl Swensen, CEO and Co-founder of Pull Logic, discusses how their AI-enabled technology helps retailers, brands, and manufacturers reduce lost sales by addressing supply chain and selling process failure points. Summary: Solving the $1.8
The issue is that when companies optimize functional metrics, they throw the supply chain out of balance and sub-optimize value. The third step is to do a data inventory. When I studied at Temple for my DBA, I did an academic search on what is value in the supply chain. Supply chain leaders love bright and shiny objects.
We have found that supply chain metrics are gnarly and complicated.During We believe that a supply chain leader is defined by both the level of performance on the Effective Frontier (balance of growth, Return on Invested Capital, Profitability and Inventory Turns) and driving supply chain improvement.
After two decades of study, I think because it is a lack of understanding. At each company, there is a relationship between the metrics of growth, margin, inventory, customer service, and asset strategy. I term this relationship between metrics and capabilities as the company’s Effective Frontier. A Case Study.
Using balance sheet data from 2011 to 2019, we chart companies’ progress by peer group on rate of improvement and performance in the metrics of growth, operating margin, inventory turns, and Return on Invested Capital (ROIC). In the past study, of 600 companies studied, 4% make a list. It seems easy, right?
Picture this: You’re a warehouse manager, and with a few taps on your smartphone, you instantly know the exact location and quantity of every item in your inventory. That’s not science fiction—it’s the power of mobile inventory management. Ready to turn your inventory from a headache into a strategic asset?
How aligned do you believe your organization is to drive these metrics? P&G did not appreciate the work Gilette accomplished on form and function of inventory and using market signals. As a result, the company’s performance at the intersection of margin and inventory turns was circular for the past decade.
This year supply chain leaders will celebrate thirty years of progress in supply chain management; but we have not made progress on one of the funamentals: inventory management. I think that it is time for us to take the litmus test and ask the hard questions, “Have our practices impacted days of inventory? I want to believe.
Analysis of case study is certainly one of the most popular methods for people from business management background. In order to accelerate the learning, this article has gathered 20+ most sought-after supply chain case studies, analyzed/categorized them by industry and the findings are presented.
Over the last six years, we studied the connection between business results (growth, operating margin, inventory turns and Return on Invested Capital (ROIC)) and the link to company characteristics. Reward teams for cross-functional metrics. Focus functional metrics to improving reliability. ” Hau Lee, October 2014.
In the recent study of the Voice of the Supply Chain Leader , we find that the gaps are large, and growing. I also think that Quintiq’s leadership in concurrent planning to solve new problems is promising, especially in the design of transportation and inventory flows. Service level is our most important metric.
The use of orbit charts allowed me to see the patterns of performance at the intersection of metrics over time. For the past decade, I have been studying these patterns. The second part of the story is that inventory turns for Lenovo are 10.8, Ranking at #13, PepsiCo outperforms on inventory turns, but performance is declining.
We talk about the move from functional metrics to a balanced scorecard, but we don’t use a balanced scorecard as an objective function. Orbit charts of four companies for the period of 2013-2022 at the intersection of operating margin and inventory turns. We talk about complexity, but do not measure the impact on forecastability.
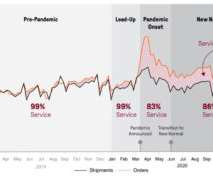
A study by E2open – the 2021 Forecasting and Inventory Benchmark Study: Supply Chain Performance During the Covid-19 Pandemic – provides the answers. I look forward to this study every year. The company provides demand and inventory planning solutions based on a public cloud architecture.
Which companies were considered in the study? They had to be publicly traded, we had to have a nearly complete data set for the years studied, and they had to have a peer group of at least six companies to be able to draw the comparisons. Yes, we will do this study yearly in the preparation for our annual conference.
The future inventory fire sale. We are living in a world of rich supply chain case studies. One of my stark realizations this year is that smaller companies are beating larger and often more established companies on growth metrics, inventory turns, operating margin, and Return on Invested Capital (ROIC). (In Toilet Paper.
Tom, the colorful warehouse manager, constantly heckled Frank for the increasing inventory levels while Ed, the quiet material/logistics manager, constantly questioned if there was a better way. He felt that inventory was no problem, he would just cut it at the end of each quarter to make the balance sheet goals. The So What?
In research study after study, we see that the greatest challenge to achieving supply chain excellence is the understanding of the supply chain by the leadership team. Closing the gaps happens when there are aligned metrics, clarity of vision and aligned planning processes. Metrics Alignment. They lack cohesion.
In my forty years of studying supply chain planning, the groups became larger, but with questionable results. We explore the concept of holistic inventory strategies focused on the form and function of inventory. 85% of inventory decisions are not managed in Advanced Planning Solutions. Lack of aligned metrics.
Last month, we finished a study of organizational alignment with over 200 respondents. In prior studies, the lack of understanding by the executive team is a major barrier. We have completed two studies now that show Sales and Operations planning improves both agility and alignment. The supply chain view is listed in figure 1.
The relationship between corporate financial performance and supply chain metrics was complex; and in my first attempts, I was unable to derive a correlation. I wanted to better understand which metrics truly mattered. The Metrics That Matter Are Different by Industry Sector. However, as many of you know, I am stubborn.
It is a quest and the subject of my next book, Metrics That Matter , that will publish in September, 2014. We have found that nine out of ten organizations are stuck on their ability to make improvements on both operating margin and inventory turns in the same year. .” As I shuffle along, I am not sure. I shake my head.
Despite two decades of advancement in supply chain technologies, companies are struggling to gain balance at the intersection of operating margin, inventory turns and case fulfillment. I have learned that supply chain systems are more complex than I originally thought, and that the relationships between supply chain metrics are nonlinear.
The impact of complexity on inventory is not quick. To help, today I want to share some of the insights from our recent Inventory Optimization study. Inventory management is a hot issue. Companies invest in project after project, yet inventory levels remain the same. The Business Problem.
If you ask companies if they would like better inventory and global supply chain visibility, you will get an overwhelming answer of, “Yes!” In our recent report on defining supply chain visibility in B2B networks, we provide a definition based on a research study of over seventy participants. ” The answer is simple.
Recent examples included the rollout of a new inventory planning application and the introduction of a hybrid AI-powered demand forecasting engine. Clark noted that these developments were designed to meet emerging customer needs, particularly in markets experiencing unpredictable demand and inventory constraints.
If the arrow is red, the industry is moving backwards on a metric. The industry made progress on revenue/employee, but struggled on growth, margin, inventory turns. Some of the strongest case studies of supply chain leadership are in this value chain. Companies, based on culture, tend to focus on singular metrics.
History will also include case studies of mergers and acquisitions. The study of improvement and performance for the 535 companies in 26 industries took two months. It is not as simple as trading-off inventory, cost, and customer service. We selected these metrics based on correlation work with Arizona State University in 2012.
“I study supply chains. In our work, we tie research from quantitative and qualitative studies to financial results to drive new insights. I also believed that this company would have the best inventory and customer service. My favorites are customer service, operating margin, inventory turns, and ROIC. I was wrong.
I just don’t think the comparison of very different industries in a spreadsheet based on growth, inventory values, and Return on Assets (ROA) is meaningful. As a result, the metrics have to be viewed together as a pattern over time. In the journey, the supply chain leader needs to improve the potential of a portfolio of metrics.
Companies with the lower score on the Index are driving faster rates of metrics improvement. Energizer and Unilever are driving the fastest rates of improvement and Clorox and P&G improvement rates are the slowest on the Metrics That Matter of Growth, Operating Margin, Inventory Turns, and Return on Invested Capital (ROIC)).
As I write my new book, Metrics That Matter, I am studying the patterns of corporate performance based on choices in supply chain program execution. A company that is effectively working a supply chain strategy will have a nice, neat pattern at the intersection of operating margin and inventory turns. So, what can we learn?
For the past five years, the team at Supply Chain Insights identified Supply Chains to Admire Award Winners by analyzing performance by peer group on the key metrics of growth, operating margin, inventory turns and Return on Invested Capital (ROIC). In 2018, Rockwell Automation won the Supply Chains to Admire Award. Meet Ernest.
In a recent study, our goal was to understand the impact of process and technology choices on balance sheet performance. We analyzed the impact of 150 factors on 493 financial metrics for the period of 2004-2016. This included responses to 3604 questions by 1063 individual respondents in 40 studies representing 756 unique companies.
We were discussing the results of the planning benchmarking work that we have just finished, and I was sharing some insights on inventory management when one of the panelists emphatically stated, “Inventory is a waste to manage. We feel so strongly about this that we do not have an inventory planning role.”
In the study, the respondents were asked to rate time to Return on Investment, and satisfaction. It is tough for me to see that nine out of ten companies are stuck, and not making progress, at the intersection of operating margin and inventory turns. In addition, I am now done with the page proofs for my new book, Metrics that Matter.
We organize all of the trending information in your field so you don't have to. Join 102,000+ users and stay up to date on the latest articles your peers are reading.
You know about us, now we want to get to know you!
Let's personalize your content
Let's get even more personalized
We recognize your account from another site in our network, please click 'Send Email' below to continue with verifying your account and setting a password.


Let's personalize your content