This site uses cookies to improve your experience. To help us insure we adhere to various privacy regulations, please select your country/region of residence. If you do not select a country, we will assume you are from the United States. Select your Cookie Settings or view our Privacy Policy and Terms of Use.
Cookie Settings
Cookies and similar technologies are used on this website for proper function of the website, for tracking performance analytics and for marketing purposes. We and some of our third-party providers may use cookie data for various purposes. Please review the cookie settings below and choose your preference.
Used for the proper function of the website
Used for monitoring website traffic and interactions
Cookie Settings
Cookies and similar technologies are used on this website for proper function of the website, for tracking performance analytics and for marketing purposes. We and some of our third-party providers may use cookie data for various purposes. Please review the cookie settings below and choose your preference.
Strictly Necessary: Used for the proper function of the website
Performance/Analytics: Used for monitoring website traffic and interactions
In today’s architectures and functional metrics, value optimization does not exist. And, when procurement and tactical planning operate in isolation, there is no decision support framework to guide the trade-offs especially when the functions are tethered to different and conflicting metrics. You are right.
The survey was one of many, and I found the project relatively nondescript, bordering on boring. One of my lessons learned in completing survey-based research over the past twelve years, is that projects are full of surprises. In the survey, companies had over one hundred active continuous improvement programs.
Creating a data-driven supply chain tracking important transportation metrics helps shippers respond and adapt as quickly as possible to known and unknown events. Why Monitor Transportation Metrics. Transportation metrics provide visibility that helps drive operative and competitive advantages.
These steps include sourcing and receiving inventory, storing inventory, order processing, picking and packing an order, shipping the order, and returns management. Factors like planning tools, inventory management, demand patterns, and innovations in technology contribute to the success or failure of fulfillment optimization.
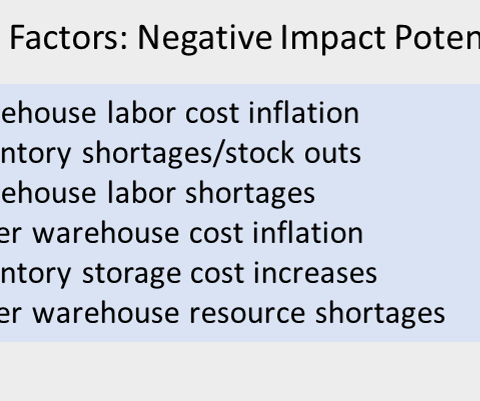
Supply shortages resulting in empty shelves or parking lots of WIP inventory represent a spectre causing supply chain leaders to reconsider supply chain inventory practices. Opinion of just-in-time (JIT) as a practice has taken a battering and inventory is rising. Is supply chain inventory the problem?
Let me explain, if you fill out one of my surveys on LinkedIn, I share the research results in front of the paywall (I believe that supply chain research should be readily available and not locked behind a paywall.) (If Use of Supply Chain Descriptors Most organizations are locked into functional silos driven by functional metrics.
This year supply chain leaders will celebrate thirty years of progress in supply chain management; but we have not made progress on one of the funamentals: inventory management. I think that it is time for us to take the litmus test and ask the hard questions, “Have our practices impacted days of inventory? I want to believe.
Results from The Conference Board’s C-SUITE OUTLOOK survey showed supply chain disruptions, labor shortages, and rising inflation to be 3 of the 5 high impact external factors on the minds of CEOs. Here are some preliminary survey results thus far. There are numerous indications that supply chain is more critical than ever.
I just don’t think the comparison of very different industries in a spreadsheet based on growth, inventory values, and Return on Assets (ROA) is meaningful. As a result, the metrics have to be viewed together as a pattern over time. In the journey, the supply chain leader needs to improve the potential of a portfolio of metrics.
But the sheer complexity of supply chain networks, and the impact design decisions have on operational performance, makes supply chain inventory management aligning inventory investments with on-time customer delivery and margins a major challenge. trillion in cash according to a 2013 US Working Capital Survey.
Transportation metrics saw little change in May as capacity, utilization and pricing remained in expansion territory, according to a monthly survey of supply chain professionals. Inventory costs (78.4) percentage points even as growth in inventory levels (51.5) slowed by 5.5 Upstream firms (56.5) highly inflationary.
The relationship between corporate financial performance and supply chain metrics was complex; and in my first attempts, I was unable to derive a correlation. I wanted to better understand which metrics truly mattered. The Metrics That Matter Are Different by Industry Sector. However, as many of you know, I am stubborn.
In a survey of 150 global manufacturing executives, 47% committed to improving supply chain visibility and tracking. According to the Global Supply Chain Disruption and Future Strategies Survey Report, this goal was the top-ranked planned tool investment. Agility to act on transparency.
As hospitals adopted consignment planning programs, inventory progress slowed. The turns are the lowest of any industry, and despite investments in technologies and processes, inventory turns have only improved 3%, and Cash-T0-Cash (C2C) cycles have declined 4%. The shift of inventory without the sharing of data is a mistake.
What is the Perfect Delivery Metric? Improving on this metric will always involve a focus on people and processes, but often also includes implementing new, more robust, supply chain applications. The wrong metrics drive suboptimal behaviors and metrics can often be manipulated.
The impact of complexity on inventory is not quick. To help, today I want to share some of the insights from our recent Inventory Optimization study. Inventory management is a hot issue. Companies invest in project after project, yet inventory levels remain the same. The Business Problem. The analogy is weight loss.
I also believed that this company would have the best inventory and customer service. It is one of the primary reasons why nine out of ten manufacturing companies are stuck at the intersection of operati ng margins and inventory turns.” My favorites are customer service, operating margin, inventory turns, and ROIC.
Focus the organization on understanding the “probability and patterns of demand” and how to design push/pull decoupling points, supplier networks and inventory buffers to improve agility (focusing on form and function of inventory in the supply chain). Next week, I will be writing on my new book Metrics That Matter.
In the annual report where they report on their key performance indicators (KPIs), they don’t just report on core financial metrics and the NPS, they also have people metrics. Their associate engagement survey allows Ferguson to understand the driver’s impacting engagement across their 31,000 employees. The company recorded 1.9
Even if you’re not you should check out Supply Chain Insights, Supply Chain Metrics That Matter. The challenge is balancing reduced material delays with rising inventory levels and longer Days of Inventory. For the past several years, Supply Chain Insights has been delivering this research series.
When it comes to the management of inventory in value chains, frustration abounds. Executive, after executive, lament, “They have purchased many technologies and sponsored many projects to reduce inventories, but they are not seeing results.” Inventory is the culmination of many business decisions. Tracking Progress.
GEP and the North Carolina State University (NCSU) Supply Chain Resource Cooperative surveyed supply chain, procurement and IT professionals across a range of industries to gain insight into their priorities and strategies regarding supply chain resilience and optimization. Alex Zhong, Director Product Marketing at GEP.
We analyzed the impact of 150 factors on 493 financial metrics for the period of 2004-2016. Across the industry, we find that companies think that they are managing costs and inventory better through technology investments like supply chain planning, but they have a false sense of accomplishment. This research was tough work.
The latter refers to a single variable standard (SVS), by which one metric, such as cases per hour, is expected to tell all. What’s more, because an SVS approach only accounts for one metric at a time, a host of other equally if not more important metrics are bypassed, leaving you largely in the dark. Inventory mix.
It’s an excerpt from “Supply Chain Talent of the Future,” Deloitte’s report on their third annual supply chain survey. This year’s survey focused on the readiness of today’s workforces to deal with tomorrow’s supply chain challenges. Two metrics. Now, there are big differences in other areas of the survey results, too.
A recent report says that more than 77% of companies said, in a survey, that they are investing in deeper and more collaborative supplier relationships to improve resilience and agility. Consequences of Lack of PO Collaboration Capabilities Failure to prioritize PO collaboration can lead to severe consequences for companies.
In this guide we walk through the essential steps to design a layout, implement labeling and slotting strategies, manage inventory with lean principles, and adopt technology solutions that keep operations agile. Validate your plan periodically: time actual travel routes, survey staff, and solicit forklift operator feedback.
It’s an excerpt from “Supply Chain Talent of the Future,” Deloitte’s report on their third annual supply chain survey. This year’s survey focused on the readiness of today’s workforces to deal with tomorrow’s supply chain challenges. Two metrics. That’s it.
According to McKinsey survey of global supply chain leaders , only 53% of respondents describe the quality of data in their supply chain planning systems as “sufficient” or “high.” By setting benchmarks for metrics, analysts can recognize unsettling trends and take preventive measures on time.
by Andrew Dunbar The modern day inventory manager described in this series is the backbone of your company’s inventory planning process. She has a strong understanding of supply chain fundamentals and is an expert at controlling the key levers impacting the inventory company’s investment in inventory. Closed Loop.
Gartner says that the most common outsourced SCP processes are inventory management, statistical forecasting and service parts planning. Companies moving to BPO in these practice areas are experiencing supply chain improvements in metrics such as inventory turnover and customer service. versus $4.84 per $1000 of revenue).
If the arrow is red, the industry is moving backwards on a metric. The industry made progress on revenue/employee, but struggled on growth, margin, inventory turns. Companies, based on culture, tend to focus on singular metrics. If the arrow is green, progress was made. Is this because this value chain is a laggard?
We loaded 493 financial metrics from balance sheets and income statements for each company into the data lake for the period of 2004-2016 using YCharts data. They all sound alike and each company makes similar claims of how the implementation of supply chain planning improves costs, lowers inventory and improves the return on assets.
Companies with the lower score on the Index are driving faster rates of metrics improvement. Energizer and Unilever are driving the fastest rates of improvement and Clorox and P&G improvement rates are the slowest on the Metrics That Matter of Growth, Operating Margin, Inventory Turns, and Return on Invested Capital (ROIC)).
While companies have increased Revenue per Employee across the healthcare value chain, the Days of Inventory have increased for suppliers, and there is a shift in power to the healthcare provider. I also see that we are not decreasing the total inventory levels in the network or accelerating time to value. Progress is stalled.
Supply chain reports are data-driven documents that provide key metrics and insights into various aspects of your supply chain, including: Inventory Levels Tracking stock levels in real-time to ensure adequate inventory to meet demand while minimizing holding costs.
by Andrew Dunbar Inventory is often the single largest asset on a company’s balance sheet and your inventory management process can have a huge impact on your organization’s bottom line. When you think about the priorities of your inventory management process, what’s the first thing that comes to mind? We want your feedback.
I think about this discussion with Keith often as I work on the Supply Chain Index and edit the chapters of Metrics That Matter. In Figure 1, I share a composite orbit chart of progress of Cisco Systems, Intel, Samsung and Flextronics on the Effective Frontier at the intersection of inventory turns and operating margin for 2006-2012.
percent of returns, or $101 billion worth, were fraudulent last year, according to a survey by Appriss Retail and the National Retail Federation. billion worth, the survey found. percent year-on-year decline in cargo ton miles to 1.8bn, although this metric increased by 9.5 Retailers estimate 13.7 percent, or $24.5
” Currently working on a series of surveys to help clients answer these two questions, I struggle with the current state. Instead, in the SanDisk journey , they adjusted the speed of response to their customer segments, and actively designing inventory postponement strategies. How do they buy from you?” It is systemic.
It’s true that inventory management is a challenge for both manufacturers and distributors. For example, excess inventory can cause a decrease in product turnover and a loss of profits, while stock-outs can cause backorders, unhappy customers and lost sales. Inventory Surplus.
by Andrew Dunbar This post concludes my inventory management blog series. Throughout this series I’ve proposed an elevated role for the inventory manager that challenges the assumption that an inventory manager is a victim of his colleagues’ business decisions and plays only a limited role in formulating inventory results.
Companies typically expect that inventory levels will drop and service levels improve at the end of the first month. Planner Metrics – They implemented adoption metrics on how often planners were using the planning application or if they were experiencing any pain points in the system. This was a bold and risky move.
The more that I work on supply chain metrics, the more that I believe that both the SCOR model and the Gartner Hierarchy of Supply Chain Metrics (which I worked on for the period of 2006-2010) reward functional, not end-to-end supply chain behavior. I get called frequently to talk to supply chain leadership teams about inventory.
We organize all of the trending information in your field so you don't have to. Join 102,000+ users and stay up to date on the latest articles your peers are reading.
You know about us, now we want to get to know you!
Let's personalize your content
Let's get even more personalized
We recognize your account from another site in our network, please click 'Send Email' below to continue with verifying your account and setting a password.


Let's personalize your content