This site uses cookies to improve your experience. To help us insure we adhere to various privacy regulations, please select your country/region of residence. If you do not select a country, we will assume you are from the United States. Select your Cookie Settings or view our Privacy Policy and Terms of Use.
Cookie Settings
Cookies and similar technologies are used on this website for proper function of the website, for tracking performance analytics and for marketing purposes. We and some of our third-party providers may use cookie data for various purposes. Please review the cookie settings below and choose your preference.
Used for the proper function of the website
Used for monitoring website traffic and interactions
Cookie Settings
Cookies and similar technologies are used on this website for proper function of the website, for tracking performance analytics and for marketing purposes. We and some of our third-party providers may use cookie data for various purposes. Please review the cookie settings below and choose your preference.
Strictly Necessary: Used for the proper function of the website
Performance/Analytics: Used for monitoring website traffic and interactions
However, as carbon taxes and emissions reporting requirements continue increasing, supply chain professionals face mounting pressures from inside and outside their organizations to measure and improve performance against new, nebulous sustainability metrics. Freight transportation makes up over 10% of total global carbon emissions.
Transportation, warehousing, and manufacturing collectively contribute significantly to carbon emissions, making these areas critical for meaningful change. Similarly, shifting freight from road to rail or waterways offers lower-emission alternatives for long-haul transport.
Cloud-based transportation management offers a variety of benefits for businesses that operate in the global supply chain. But there are times when it becomes necessary to outsource the entire process thoroughly, which many refer to as transportation as a service. Why Outdated Approaches to Transportation Management Can Fall Short .
Solvoyo has a metric they call the user acceptance rate. This metric measures the percentage of time the planners accept replenishment, transportation, or inventory plans as they are without any change in the timing of the delivery or the quantity to be delivered. We have lots of functions, lots of analytics, lots of reports.”
2022 was the year of corporate commitments to sustainability, and 2023 is the year where promises become proposals, mission statements become metrics, and aims become actions. Companies will have to report on sustainability in a similarly controlled way as they do their financials. We need to act now by making the right decisions.
Transportationmetrics saw little change in May as capacity, utilization and pricing remained in expansion territory, according to a monthly survey of supply chain professionals. reading for transportation capacity during May, which was roughly in line with April. SONAR: Logistics Managers’ Index (Transportation Prices).
Use of Supply Chain Descriptors Most organizations are locked into functional silos driven by functional metrics. Stuck in a rut, supply chain leaders try to punch their way through a set of conflicting metrics and priorities each day. The metrics defining success in manufacturing and procurement do not align.
Functional Metrics and the Lack of Alignment to Strategy. Process-based companies continue to focus on manufacturing efficiency (OEE) and discrete on procurement (PPV) without designing the supply chain to balance transportation, manufacturing, and procurement to a balanced scorecard. These two reports are coming soon.
Additional opportunities can be reached through transportation optimization whether using a 3PL or 4PL. It's important to understand how transportation optimization can work well with managed transportation service providers to attain that goal. Defining Transportation Optimization.
Samuel Parker and Joe Lynch discuss DAT iQ: the metrics that matter. Key Takeaways: DAT iQ: The Metrics that Matter In the podcast interview, Samuel Parker gave a freight market overview based on DAT’s database of $150 billion in annual market transactions. He lives in Denver, Colorado with his wife and son.
We trudge on with our top posts from our main blog categories by page view for all of 2014 from the Cerasis blog by featuring another area Cerasis is an expert in: Transportation. These tips include how you yourself can better manage your transportation department and maximize resources. Read the Full Blog Post.
With freight transport accounting for a significant share of global emissions, efforts to improve logistics now extend beyond operational metrics to include resilience, regulatory compliance, and climate performance. A related challenge lies in emissions tracking and reporting.
Managing OTR transportation through disruption is a complex process. We’re sharing seven best practices to improve OTR transportation management, enabling shippers to stay competitive in the face of disruption. Analytics provides visibility into your transportation network and operations. Across OTR Transportation Modes.
System Integration and Data Visibility Orchestration requires connecting warehouse systems, transportation platforms, and ERP data so that status updates, inventory levels, and shipping exceptions are visible without needing to log in to separate systems. Dell reports reduced cycle times and improved productivity as a result.
SCB Feature Report From DPW: What’s Next for AI in Supply Chain? AI will also come to the fore to help companies manage their carbon footprint, greenhouse gas emissions and other sustainability issues, especially reporting, Koganti said, and not least Scope 3 emissions, which are currently the bane of supply chain sustainability.
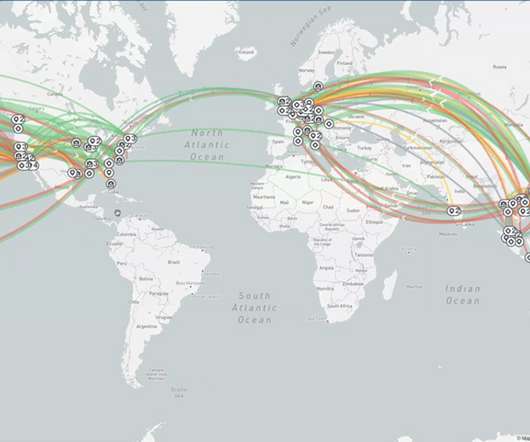
A disruption at any point in the global logistics network including the average of 12 touch points from shipment packaging to final delivery can prove disastrous for profits, service levels, customer loyalty, and other key metrics. With the global e-commerce market predicted to reach $8.1 That is the beauty of a platform enabled by AI.
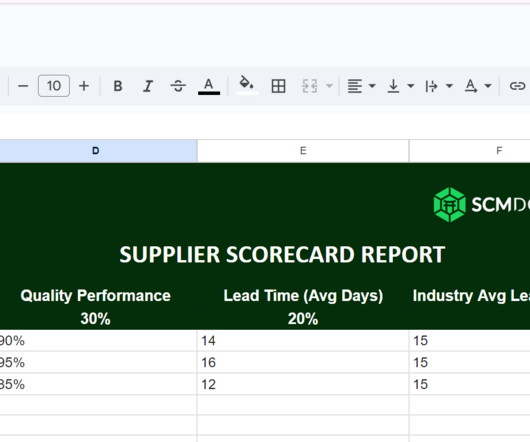
Supply chain reports offer a comprehensive view of your entire supply chain operation. What are Supply Chain Reports? Supplier Performance Evaluating supplier performance based on key metrics such as on-time delivery, quality of goods received, adherence to agreed-upon terms, and responsiveness to inquiries.
When it comes to executing mode-specific freight moves from origin to destination efficiently, reliably, and cost-effectively, transportation execution and visibility solutions play a critical role. Transportation execution solutions allow shippers to connect to multiple carriers and then tender, track, and pay in the system.
Many large organizations have multiple systems for order, warehouse, or transportation management that are barely integrated frequently not at all. Ability to Meet Fulfillment Goals According to the survey, only a mere 1% of respondents achieve 80% or higher for their OTIF metrics, with the average percentage of OTIF being a mediocre 62.21%.
We consistently see that companies focused on functional excellence–a focus within a functional silo like manufacturing, transportation or distribution– or singular metrics– like inventory or costs– underperform against their peer groups. Reward teams for cross-functional metrics. What did we find?
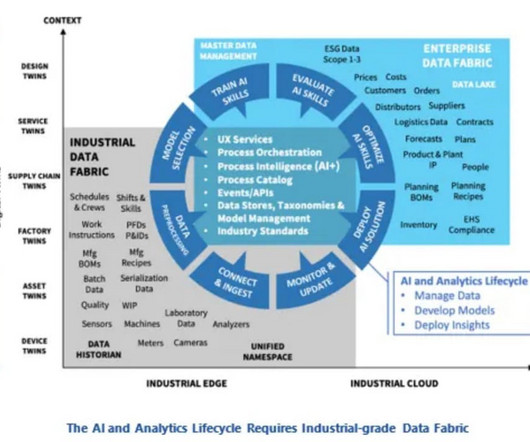
Mr. Masson recently wrote the report “ Industrial-grade AI: Transforming Data into Insights and Outcomes.” Not all the transactional data, just the data required to calculate a metric or make a decision. Mr. Masson leads ARC’s research on industrial AI and data fabrics. So, we deploy an agent on an SAP environment.
Supply chain efficiency is the cornerstone of success and involves the effective management of processes, resources, and technologies from procurement to production, transportation to warehousing. Transportation and Logistics: The goal here is to minimize delivery costs while maintaining reliable service levels.
Much talk about sales, automation and improved processes dominate the conversation when considering outsourcing logistics processes to a transport and logistics providers or using a 3PL-based transportation management system (TMS). In reality, the actual savings and return tend to be closer to 10 percent, reports Inbound Logistics.
With global transportation costs climbing and carrier networks becoming more complex, transportation spend management has become a strategic priority — not just a back-office function. Why Transportation Spend Management Demands Better Data Transportation spend often ranks as one of the top operational costs for shippers.
These include: Challenges getting ESG metrics from suppliers, partners, and other third parties. Time-consuming manual processes to report on ESG metrics. On the transportation side, a cloud-based TMS integrated with IoT capabilities can help you make lower-carbon transportation choices. The challenge of change.
As an old gal, with over forty-years of supply chain experience, writing this report for ten years taught me many lessons. I find in the orbit chart analysis that 45% of companies in the report are unconsciously incompetent. The group’s response is, “Are these supply chain metrics?” I admit it.
Data analytics helps you monitor key performance indicators (KPIs), like supplier performance, delivery times, and transportation efficiency — all in real-time. Finally, establish standardized data collection procedures across all relevant departments, ensuring consistent measurement and reporting.
This of course generates carbon from transportation activities. In the early 2020s, Microsoft’s transportation and logistics team needed to meet growing demand for cloud services while managing carbon, cost and cycle time. Microsoft’s transportation is outsourced to carrier partners.
For logistics professionals, this translates to smarter warehouse layouts, more accurate transportation planning, proactive maintenance scheduling, and a new level of resilience through cost-to-serve optimization. This article explores how digital twins are being deployed in transportation, warehousing, and network design.
Throughout the supply chain, the use of metrics to track and understand processes provides an invaluable resource for ensuring increased production and customer satisfaction. What Distribution Center Metrics Need Tracking? However, the most important metrics can be categorized into the following eight areas. On-Time Shipping.
Yes, we have achieved greater normalcy in transportation. For organizations layered in functional metrics and driving a cost agenda, this is a tough nut to crack. If you click the link, please be assured that all responses are reported in aggregate, and the names are anonymous. The ride is uphill, but the visibility is low.
In preparation for the summit, we readied the final report of the work on translating balance sheet results into a methodology to judge Supply Chain Excellence. This report, Supply Chains to Admire , compares the progress of 200 companies within their respective peer groups on both performance and improvement. Aligned Metrics.
Based on ARC Advisory Group’s new global market report, the three largest providers of MSCN, listed alphabetically, are Descartes, E2open, and Infor Nexus. Their solutions include omni-channel, demand sensing, supply planning, global trade management, transportation management, collaborative manufacturing, and supply management.
Today, we kick off our annual year end series highlighting the top blog posts in each of our 7 main categories: Manufacturing , Supply Chain , Logistics , 3PL , Business , Transportation , Freight. Finally, the top 10 list was rounded out safety and metrics. These will only contain posts written in 2014. Read Full Post.
This weekend, I edited the Supply Chains to Admire report. The report was scheduled to publish in the summer of 2023, but life got in the way. The full report publishes this week. I laugh that writing the report is like a root canal. With surgery, I just never got to the report finished. Writing it takes weeks.
According to the Global Supply Chain Disruption and Future Strategies Survey Report, this goal was the top-ranked planned tool investment. Ipsen faced transportation capacity constraints, complications at country borders, and even temporary shutdowns at their own plants. What is supply chain visibility?
Acquisition of 3GTMS On March 24, 2025, Descartes acquired all of the shares of 3GTMS, a leading provider of transportation management solutions. However, Adjusted EBITDA and Adjusted EBITDA as a percentage of revenues are non-GAAP financial measures and may not be comparable to similarly titled measures reported by other companies.
I believed that we would find a company with the lowest distribution costs (warehousing and transportation), and the lowest manufacturing costs, and this would result in the best overall cost structure. This can either be through direct reporting or a matrixed organization. It was not measured. If not, I am afraid we have a misnomer.
This extensive connectivity has resulted in impressive metrics: 1.2 As reported by Home Depot, implementing project44’s solutions reduced their “where’s my order” inquiries by 70%, demonstrating the platform’s impact on customer experience. A key differentiator is Movement’s approach to data quality.
In the financial year covered by the annual report, the company had seven acquisitions and one divestiture. In the annual report where they report on their key performance indicators (KPIs), they don’t just report on core financial metrics and the NPS, they also have people metrics. The company recorded 1.9
Today, we are nearing the end of the fourth quarter of corporate reporting. Self-reported projections of the ocean carriers forecast that the industry is posting over $200B in profits. Maersk, the world’s largest container shipping company, reported its best quarter in 117 years, posting a $5.9B profit for Q3 on $16.6B
While ERP systems provide excellent tools to manage accounting, human resources, customer relationships and more, they considerably lack the tools needed to properly manage transportation. While respondents reported different lengths of time until they “broke even”, the median point for TMS was found to be less than one year.
Some logistics involves transportation or warehouses or both. We had a great turnout with over 250 logistics managers, supply chain officers, and those in the transportation world registering and attending the webinar. There are countless number of logistics service providers who offer many different types of broad and niche services.
Background In a prior Supply Chain Matters commentary , we provided highlights and observations related to February 2025 production and supply chain activity levels as provided by various global wide and regional PMI index reporting. The reported overall value of 62.8 The reported overall value of 62.8 respectively.
We organize all of the trending information in your field so you don't have to. Join 102,000+ users and stay up to date on the latest articles your peers are reading.
You know about us, now we want to get to know you!
Let's personalize your content
Let's get even more personalized
We recognize your account from another site in our network, please click 'Send Email' below to continue with verifying your account and setting a password.


Let's personalize your content