This site uses cookies to improve your experience. To help us insure we adhere to various privacy regulations, please select your country/region of residence. If you do not select a country, we will assume you are from the United States. Select your Cookie Settings or view our Privacy Policy and Terms of Use.
Cookie Settings
Cookies and similar technologies are used on this website for proper function of the website, for tracking performance analytics and for marketing purposes. We and some of our third-party providers may use cookie data for various purposes. Please review the cookie settings below and choose your preference.
Used for the proper function of the website
Used for monitoring website traffic and interactions
Cookie Settings
Cookies and similar technologies are used on this website for proper function of the website, for tracking performance analytics and for marketing purposes. We and some of our third-party providers may use cookie data for various purposes. Please review the cookie settings below and choose your preference.
Strictly Necessary: Used for the proper function of the website
Performance/Analytics: Used for monitoring website traffic and interactions
For example, if I improve the cost structure in transportation, procurement, manufacturing and sales independently, what decision support framework decides the right trade-offs? In today’s architectures and functional metrics, value optimization does not exist. You are right. This work was expensive. This is an opportunity.
Road freight alone accounts for approximately 7% of global CO2 emissions, with maritime and air transport further amplifying the environmental burden. Proactively adopting cleaner energy sources ensures alignment with these evolving regulations. Reducing packaging volume and weight also decreases transportation emissions.
Transportation, warehousing, and manufacturing collectively contribute significantly to carbon emissions, making these areas critical for meaningful change. Similarly, shifting freight from road to rail or waterways offers lower-emission alternatives for long-haul transport.
During his tenure in the industry, he built innovative pricing and forecasting models, leveraging internal and external data sources to improve internal decision-making and increase profitability. Prior to joining DAT, Adamo led the pricing and decision science teams at FedEx.
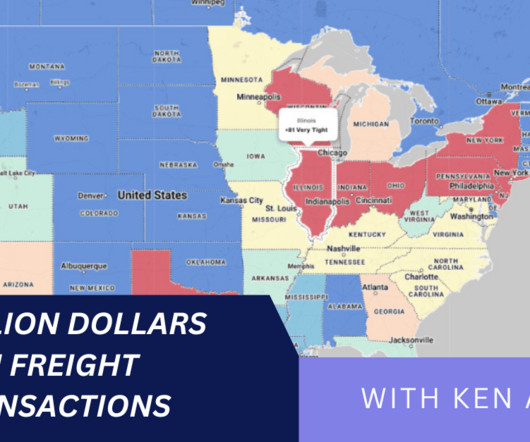
Samuel Parker and Joe Lynch discuss DAT iQ: the metrics that matter. Key Takeaways: DAT iQ: The Metrics that Matter In the podcast interview, Samuel Parker gave a freight market overview based on DAT’s database of $150 billion in annual market transactions. He lives in Denver, Colorado with his wife and son.
Managing OTR transportation through disruption is a complex process. We’re sharing seven best practices to improve OTR transportation management, enabling shippers to stay competitive in the face of disruption. Analytics provides visibility into your transportation network and operations. Across OTR Transportation Modes.
Below, we dive into their key takeaways and explore five practical ways to make your logistics data actionable, with insights grounded in industry trends and high-authority sources. The Logistics Data Challenge The logistics sector is awash with data, from shipment volumes and freight rates to sustainability metrics and supplier performance.
Reducing cost was the primary objective, and most operational decisionsfrom sourcing to fulfillmentreflected that mindset. Political instability has disrupted transportation corridors. Metrics must reflect the new priorities. For years, supply chains were engineered to be lean. Lean models alone are no longer sufficient.
Many large organizations have multiple systems for order, warehouse, or transportation management that are barely integrated frequently not at all. Optimizing fulfillment requires a series of steps to get a shipment from its source to the end customer. The ability to meet fulfillment goals is impeded by several issues.
Data-Driven Insights: DAT offers advanced analytics, providing shippers with actionable insights to optimize transportation decisions and mitigate risks. RateView Analytics: DAT helps manage transportation costs with accurate market data, allowing shippers to set realistic budgets and adjust rates during volatile conditions.
A disruption at any point in the global logistics network including the average of 12 touch points from shipment packaging to final delivery can prove disastrous for profits, service levels, customer loyalty, and other key metrics. With the global e-commerce market predicted to reach $8.1 That is the beauty of a platform enabled by AI.
The issue is that when companies optimize functional metrics, they throw the supply chain out of balance and sub-optimize value. We have not designed the planning systems to serve managers, directors, and vice presidents, aiming to improve decision-making and collaboration across the source, make, and deliver processes.
Supply chain efficiency is the cornerstone of success and involves the effective management of processes, resources, and technologies from procurement to production, transportation to warehousing. Transportation and Logistics: The goal here is to minimize delivery costs while maintaining reliable service levels.
We consistently see that companies focused on functional excellence–a focus within a functional silo like manufacturing, transportation or distribution– or singular metrics– like inventory or costs– underperform against their peer groups. Reward teams for cross-functional metrics. What did we find?
Use metrics like lead-time sensitivity, margin contribution, and order volume to prioritize. Companies with dual sourcing and buffer inventory got back on track faster. One is about reacting quickly. The other is about recovering well. What Disrupts Supply Chains Today? It should be woven into how the supply chain is run.
It’s the key to transforming your supply chain from a source of frustration into a well-oiled, profit-generating machine. Data analytics helps you monitor key performance indicators (KPIs), like supplier performance, delivery times, and transportation efficiency — all in real-time. That’s where data analytics comes in.
These include: Challenges getting ESG metrics from suppliers, partners, and other third parties. Time-consuming manual processes to report on ESG metrics. From product design, sourcing and operations planning, to manufacturing, logistics and warehousing, there are many opportunities for improved efficiency at each stage of the process.
With global transportation costs climbing and carrier networks becoming more complex, transportation spend management has become a strategic priority — not just a back-office function. Why Transportation Spend Management Demands Better Data Transportation spend often ranks as one of the top operational costs for shippers.
What is the Perfect Delivery Metric? Improving on this metric will always involve a focus on people and processes, but often also includes implementing new, more robust, supply chain applications. The wrong metrics drive suboptimal behaviors and metrics can often be manipulated.
At a high level, procurement focuses on sourcing the goods and services an organization needs, while supply chain management oversees the broader flow of those goods, from raw materials to end customers. Supply Chain Management (SCM) involves orchestrating a product’s or service’s entire lifecycle, from sourcing and production to delivery.
Do Set Clear KPIs and Governance Structures : Establish transparent metrics for sales, coverage, and service levels. Do Invest in Distributor Capability Building : Provide training, digital tools, and performance incentives. A well-equipped distributor is an extension of your brand and a key to market penetration.
Yes, we have achieved greater normalcy in transportation. For organizations layered in functional metrics and driving a cost agenda, this is a tough nut to crack. Build in-market sourcing. Rationalize global strategies to focus on building markets based on in-market sourcing. The ride is uphill, but the visibility is low.
The risks associated with chemical manufacturing include the storage and transportation of raw materials, finished products, and waste. They prepare equipment for maintenance, do isolation (disconnect a piece of equipment from the flow of chemicals by closing valves), look at quality or reliability metrics, and do rounds. They must be.
For logistics professionals, this translates to smarter warehouse layouts, more accurate transportation planning, proactive maintenance scheduling, and a new level of resilience through cost-to-serve optimization. This article explores how digital twins are being deployed in transportation, warehousing, and network design.
3 Key Metrics for Measuring Supply Chain Performance Beyond Cost Reduction. Transportation is measured just as a cost rather than what it does for the rest of the organization. Other areas to consider measuring as it relates to transportation: Managing inventory. Read more. .
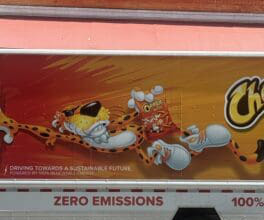
The vehicle deployments are expected to lower emissions by 7,052 metric tons of greenhouse gas (GHG) emissions annually, equivalent to 1,533 passenger cars removed from the road. The stoppage is set to “cripple shipments” of grain, potash, and coal while also slowing down the transport of petroleum products, chemicals, and autos.
The same “If” statement was repeated for a host of financial and operational metrics. The following will delve into some of the intricate farm-to-table challenges that supply chains face across sourcing, demand planning, procurement and inventory management, transportation, and warehousing.
In this blog post, we’ll explore the challenges of inventory management in today’s manufacturing landscape , discuss the importance of a “single source of truth” for global inventory, and introduce a powerful solution that can help manufacturers transform their operations and drive profitability. How do they achieve this?
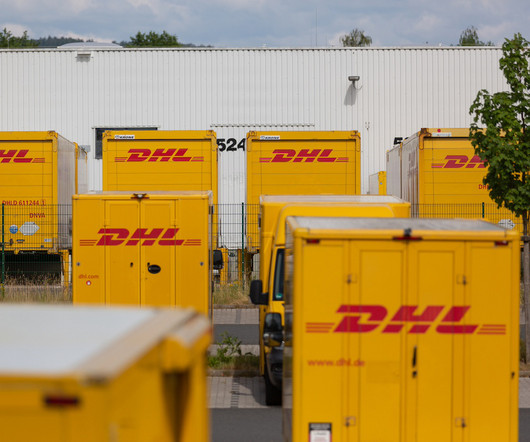
Should the work stoppage drag on, it could disrupt June 15s Formula One Canadian Grand Prix in Montreal, given that DHL is responsible for transporting the race cars used in the competition. The union also says that DHL Express added "numerous new proposals and concessions" hours before it issued its lockout notice.
Many-to-many can also refer to many participants in a network accessing many, many sources of event data critical to supply chain operations through a public cloud network. BluJay provides transportation management and managed transportation solutions. COVID of course taught companies the need for agility.
There are three reasons why: Vertical excellence—having the best manufacturing, procurement or transportation function—has not worked. Aligned Metrics. How do you balance the trade-offs between source, make and deliver? Can you help us with what you see in the data?” ” Yes, I said. Supply Chain Design.
In simple terms business procurement is the process of locating and acquiring goods and services from external sources for the business to use. Procurement activities include planning, sourcing, and negotiation, along with risk management, legal and value analysis. What is procurement? Undamaged shipment rate.
We Assumed that Transportation Would Always Be Available And That We Just Needed to Negotiate Price. Over the past decade payments to transportation carriers from shippers increased from net 30 to net 60 moving to net 90 in 2019. Build Strong Supply Chain Sourcing Development Practices. This is unprecedented time.
While there are many types of visibility (see Figure 1), the most common use case is either sourcing or transportation visibility. The focus is on functional metrics, but are unable to get to overall supply chain metrics. Visibility. The most common use case for control towers is visibility. Gaps in Enterprise Visibility.
This is because most classical planning solutions lack the modeling capability and computing power to accommodate different data sources, large SKU count, and detailed constraints and contingencies to build an immediately executable plan. each with discrete plans generated typically in sequential batch runs.
The team was organized around the functional silos of source, make and deliver. I believed that we would find a company with the lowest distribution costs (warehousing and transportation), and the lowest manufacturing costs, and this would result in the best overall cost structure. It had been this way for over two decades.
Advertise Contact Us Supplier Directory SCB YouTube About Us Login Subscribe Logout My Profile LOGISTICS Air Cargo All Logistics Facility Location Planning Freight Forwarding/Customs Brokerage Global Gateways Global Logistics Last Mile Delivery Logistics Outsourcing LTL/Truckload Services Ocean Transportation Parcel & Express Rail & Intermodal (..)
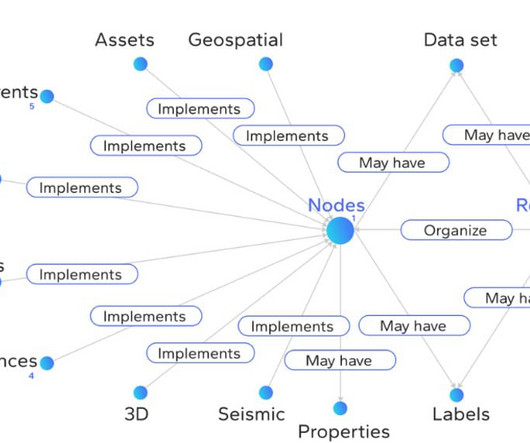
This extensive connectivity has resulted in impressive metrics: 1.2 These agents serve as a means to “connect seamlessly with existing systems” as part of project44’s API-first architecture, gathering data from sources that might otherwise be disconnected. A key differentiator is Movement’s approach to data quality.
Transportation management is no longer a tactical approach to simply moving freight and doing it at the lowest possible cost. 10 Tips to Remain Competitive and Have an Effective Transportation Management Strategy. 10 Tips to Remain Competitive and Have an Effective Transportation Management Strategy.
As product flows rapidly shifted and hard baked assumptions about lead times and sourcing locations were put to test, users across many organizations bypassed their planning systems and turned to excel sheets, internal data science teams or non-traditional supply chain vendors who could deliver AI based solutions at a faster turn.
Closing the gaps happens when there are aligned metrics, clarity of vision and aligned planning processes. It combines decisions across sell, deliver, make and source processes to drive value based outcomes. Metrics Alignment. Most companies operate well within functions, but struggle to build strong horizontal processes.
Current planning taxonomies do not plan across make, source, and deliver answers bi-directionally. For example, there is no commonality between Distribution Requirements Planning (DRP) and Transportation Planning (TMS) Real-time Planning: Planning by definition will not and should not be real-time. I don’t think so.
While it’s undeniably important to source products responsibly and produce recyclable or reusable products, companies also need to focus on making the transportation and distribution of products more sustainable. greenhouse gas emissions can be attributed to the freight transportation sector. MORE FROM THIS EDITION.
Last week, after booking an additional $1B in unexpected supplier costs in the third quarter, the CFO led the company’s focus on restructuring to “support efficient and reliable sourcing of components and internal development of key technologies and capabilities.” These capabilities do not exist at Ford. Conclusion.
We organize all of the trending information in your field so you don't have to. Join 102,000+ users and stay up to date on the latest articles your peers are reading.
You know about us, now we want to get to know you!
Let's personalize your content
Let's get even more personalized
We recognize your account from another site in our network, please click 'Send Email' below to continue with verifying your account and setting a password.


Let's personalize your content