This site uses cookies to improve your experience. To help us insure we adhere to various privacy regulations, please select your country/region of residence. If you do not select a country, we will assume you are from the United States. Select your Cookie Settings or view our Privacy Policy and Terms of Use.
Cookie Settings
Cookies and similar technologies are used on this website for proper function of the website, for tracking performance analytics and for marketing purposes. We and some of our third-party providers may use cookie data for various purposes. Please review the cookie settings below and choose your preference.
Used for the proper function of the website
Used for monitoring website traffic and interactions
Cookie Settings
Cookies and similar technologies are used on this website for proper function of the website, for tracking performance analytics and for marketing purposes. We and some of our third-party providers may use cookie data for various purposes. Please review the cookie settings below and choose your preference.
Strictly Necessary: Used for the proper function of the website
Performance/Analytics: Used for monitoring website traffic and interactions
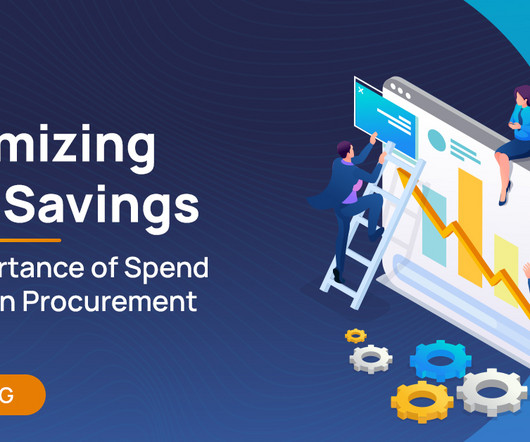
Spend analysis is often the entry point. This blog offers a clear, practical overview of what spend analysis is, how it supports strategic sourcing, and why it matters for both direct and indirect procurement. Schedule a demo of Ivalua’s Spend Analysis solution today! Discover hidden savings and take control of your spend.
The post Analysis: What a Union Pacific – Norfolk Southern merger would look like appeared first on FreightWaves. Shippers stand to benefit from faster, more reliable service—though these advantages must be weighed against the risks of reduced competition and potential integration challenges.
For example, at one point, they modeled Brazil and factored tariffs and tax considerations into the total landed costs analysis. They only promise at most 50% of the savings shown by the analysis. I would never want someone to trust 100% that what comes out of the model can be put into action.”
The ARC Advisory Group will soon begin updating the annual Supply Chain Planning Market Analysis. This analysis is conducted by analyst Gaven Simon. If you’re interested in providing the supply chain team at ARC with a briefing to discuss any developments in your solution or the market as a whole, please reach out.
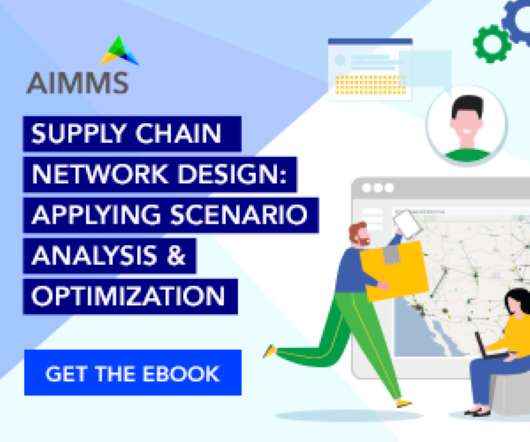
Scenario analysis and optimization defined. Explore the most common use cases for network design and optimization software. This eBook shares how supply chain leaders leverage their supply chain design software to tackle a variety of challenges and questions. What's inside? Modeling your base case.
Enhanced Promotions and Events Analysis Promotions, advertising campaigns, and trade events are vital components of marketing strategy, but accurately measuring their impact on demand remains challenging. Five Ways Advanced Machine Learning in Demand Planning Is Improving Forecasting 1.
This includes risk analysis, security of supply chains, and incident response capabilities. NIS 2 requires companies to implement appropriate technical and organizational measures to manage risks posed to the security of their network and information systems.
Failure to effectively filter, prioritize, and analyze data can lead to “analysis paralysis,” where data volumes hinder timely decision-making. Implementing connected fleets requires a comprehensive cost-benefit analysis to assess how long-term savings and improved productivity align with these initial expenses.
Download this ebook to learn how to maintain a strategy that includes refreshed information, database cleanses, and an accurate analysis at the same time. Forward-thinking marketing organizations have continuously invested in a database strategy for enabling marketing processes.
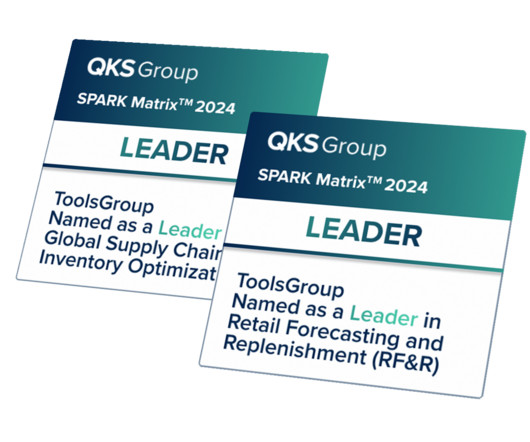
Year-on-year revenue growth, strong enterprise segmentation, a compelling vision & roadmap, and industry-specific capabilities gained ToolsGroup the top spot in our analysis.” The QKS Group SPARK Matrix™ offers an in-depth analysis of global market dynamics, major trends, vendor landscapes, and competitive positioning.
ITR Economics analysis shows rising and unmet demand for electric power from sustainability initiatives, coupled with the proliferation of data center construction ($27.3 The US is a top destination for foreign direct investment, and ITR Economics analysis suggests this re-onshoring trend is not likely to end in the near term.
Logility embeds AI directly into its solutions, helping businesses to go beyond basic data analysis, and enables those businesses to take actions they might not have anticipated. The best they can get is surface-level insights, but this is just the beginning of what AI can offer.
“Analysis of sales and review data provides deeper insights into customer behavior and preferences. “Analysis of resource consumption and supply chain practices helps you make informed decisions that reduce environmental impact, such as optimizing routes for lower emissions and selecting sustainable materials.”
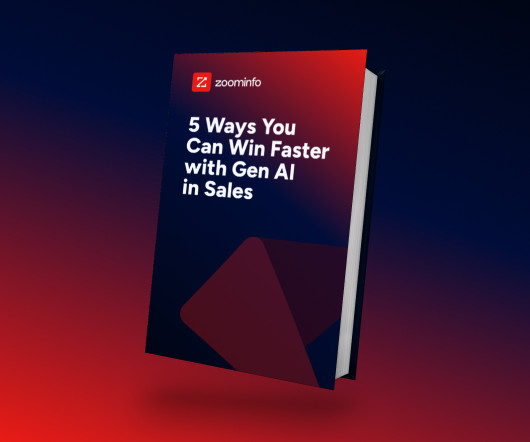
Gen AI is a game changer for busy salespeople and can reduce time-consuming tasks, such as customer research, note-taking, and writing emails, and provide insightful data analysis and recommendations. This frees up valuable time for sellers to focus more on building relationships and closing deals.
This article explores what a supplier financial assessment entails, key components of financial analysis, step-by-step guidance on conducting assessments, and best practices to integrate financial risk evaluation into supplier management all aimed at enhancing supply chain resilience.
Teams are moving away from static spreadsheets and toward systems that support continuous modeling and real-time scenario analysis. What’s changing is the role of AI – not as a replacement for human planners, but as a force multiplier. AI enables faster, more confident decision-making.
Matt specializes in delivering transformational from analysis through execution across a diverse range of clients in manufacturing, distribution, and retail. To navigate tariff uncertainty, companies must embrace agility by leveraging scenario planning, to drive decision-making and gain a competitive edge.
R&D teams will need to conduct compatibility testing, sensory analysis, and shelf-life validation to ensure product integrity is maintained. Natural dyes can alter a products appearance and interact differently with other components, affecting flavor, shelf life, or texture.
A good data story is formed by three components: Data analysis - This is the basis of a strong story and mastering the data is an essential part of the process. Data-driven storytelling could be used to influence user actions, and ensure they understand what data matters the most.
He is responsible for driving strategy, customer engagement, and industry analysis. Shippers, brokers, carriers, news organizations and industry analysts rely on DAT for trends and data insights based on a database of $150 billion in annual market transactions.
A sobering analysis in “The Policy Paradox: How US Tariffs and Tax Credits Risk Inflating Power Costs and Delaying the Energy Transition” reveals a self-inflicted dilemma: U.S. Simulation tools powered by AI now model hundreds of trade and sourcing scenarios in minutes, helping firms proactively dodge margin erosion.
Limitations of Traditional Supply Chain Planning Traditional supply chain planning relies on retrospective analysis. Let’s examine Amazon’s approach as well as the limitations of traditional supply chain planning, the operational benefits of AI, and the necessary steps for implementing AI-driven strategies.
Gaven Simon, Supply Chain analyst, has just completed the 2025 Market Analysis on WMS, and it is available for purchase. The future of warehouse management is poised for significant advancements, promising greater intelligence, scalability, and adaptability.
Data aware: Users can combine past experiences, intuition, judgment, and qualitative inputs and data analysis to make decisions. Data literate: Users have a comfort level of working with, manipulating, analyzing, and visualizing data. Download the eBook to learn about How to Build Data Experiences for End Users.
Concepts like GenAI Assistants and Agents were presented, offering conversational interfaces and on-demand analysis. The upcoming (beta version June 2025) Infor Nexus Digital Assistant will offer a conversational interface allowing users to ask complex questions, get analysis, and access transaction links directly within the platform.
Hire a consultant to do the analysis. Through the analysis, help the organization to see the fallacy in traditional thinking. Measure waste. Use a digital twin to quantify the impact on operating margin. Don’t have digital twin technology? Build Organizational Talent. Measure the tight integration of APS to ERP. Most likely.)
Conduct Comprehensive Financial Analysis Demonstrate tangible ROI by highlighting: Projected revenue improvements Cost savings Return on investment metrics Performance during market volatility Real-world data shows probabilistic forecasting can improve forecast accuracy by 15-25% compared to traditional methods.
billion rate data points monthly to provide the most comprehensive view of the market, helping you identify savings opportunities and make data-driven decisions. billion rate data points monthly to provide the most comprehensive view of the market, helping you identify savings opportunities and make data-driven decisions.
Just by embedding analytics, application owners can charge 24% more for their product. How much value could you add? This framework explains how application enhancements can extend your product offerings. Brought to you by Logi Analytics.
A significant advantage of GenAI in S&OP is the automation of complex data analysis. Employees also spend most of their time on repetitive, manual tasks – such as data entry, reporting, and analysis – that do little to challenge or engage them.
Analysis Transpacific container rates to the West Coast doubled last week on June 1st GRIs to $5,488/FEU, with the latest daily rates above $6,000/FEU as shippers start peak season early and frontload goods ahead of tariff pause expirations in July and August. America weekly prices fell 1% to $5.27/kg. China – N. Europe – N.
Inventory Management The key starting point is implementing proper ABC analysis, and you need to look at it from multiple angles. It’s not enough to just categorise by product groups; you’ve got to dig deeper into line item analysis. what we found was shocking.
Between avoiding empty miles, reducing fuel consumption, and utilizing resources/materials, there are countless areas of the supply chain that could be optimized through quantitative analysis, like carbon emissions tracking.
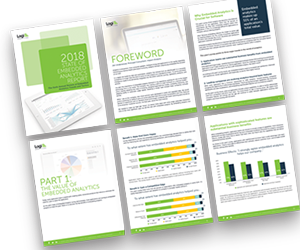
Why do some embedded analytics projects succeed while others fail? We surveyed 500+ application teams embedding analytics to find out which analytics features actually move the needle. Read the 6th annual State of Embedded Analytics Report to discover new best practices. Brought to you by Logi Analytics.
Blyncsy’s map utilizes crowdsourced dash camera imagery from over 1 million vehicles, which, combined with its AI image analysis capabilities, can detect more than 40 different road conditions and asset inventory issues in near-real time.
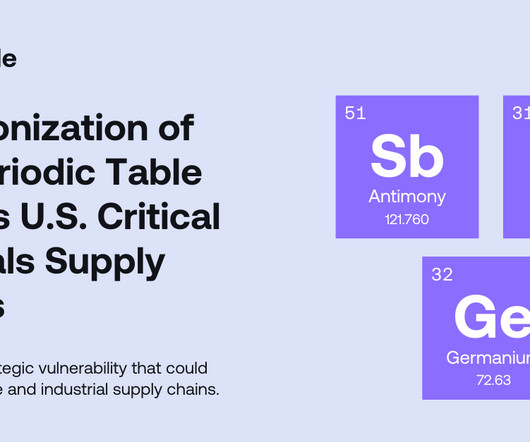
Within hours of the export ban announcement, Exiger was called on by key clients within the Defense Industrial Base (DIB), Capitol Hill, and multiple government agencies to do a quick-turn analysis of impacts on critical supply chains. Geological Survey show: The PRC supplies more than 50% of U.S. Here are some steps to aid in the process.
However, key stakeholders emerged outside official rolesindividuals not tagged as SMEs or change agentswho played critical roles in driving change impact analysis and influencing key design decisions. When visualized through a social network lens, employees can be represented as nodes, with connection strength defining their relationships.
Many application teams leave embedded analytics to languish until something—an unhappy customer, plummeting revenue, a spike in customer churn—demands change. But by then, it may be too late. In this White Paper, Logi Analytics has identified 5 tell-tale signs your project is moving from “nice to have” to “needed yesterday.".
Developing Analytical Skills Data analysis is at the heart of effective supply chain management. The inherent flexibility of MTSS platforms also accommodates various learning styles—be it visual, auditory, or kinesthetic—thereby fostering a more inclusive and effective educational environment.
Manually completing multi-variate analysis to optimize costs, lead times, and emissions is nearly impossible; however, advanced TMS systems can consider these and generate an optimal plan that balances all factors appropriately.
Traditionally, each shipment’s classification required a detailed analysis of four factors: density, handling, liability, and stowability. Classifying LTL freight has long posed challenges for shippers due to the complex, manual processes involved.
Complex analysis key to resilience The research noted that organisations need to lean into complex analytical capabilities utilising technologies like machine learning and therefore cannot be deterred by these difficulties in setting up new technologies.
Think your customers will pay more for data visualizations in your application? Five years ago they may have. But today, dashboards and visualizations have become table stakes. Discover which features will differentiate your application and maximize the ROI of your embedded analytics. Brought to you by Logi Analytics.
We organize all of the trending information in your field so you don't have to. Join 102,000+ users and stay up to date on the latest articles your peers are reading.
You know about us, now we want to get to know you!
Let's personalize your content
Let's get even more personalized
We recognize your account from another site in our network, please click 'Send Email' below to continue with verifying your account and setting a password.


Let's personalize your content