This site uses cookies to improve your experience. To help us insure we adhere to various privacy regulations, please select your country/region of residence. If you do not select a country, we will assume you are from the United States. Select your Cookie Settings or view our Privacy Policy and Terms of Use.
Cookie Settings
Cookies and similar technologies are used on this website for proper function of the website, for tracking performance analytics and for marketing purposes. We and some of our third-party providers may use cookie data for various purposes. Please review the cookie settings below and choose your preference.
Used for the proper function of the website
Used for monitoring website traffic and interactions
Cookie Settings
Cookies and similar technologies are used on this website for proper function of the website, for tracking performance analytics and for marketing purposes. We and some of our third-party providers may use cookie data for various purposes. Please review the cookie settings below and choose your preference.
Strictly Necessary: Used for the proper function of the website
Performance/Analytics: Used for monitoring website traffic and interactions
The relationship between corporate financial performance and supply chain metrics was complex; and in my first attempts, I was unable to derive a correlation. The year 2012 marked the 30th anniversary of the use of supply chain management as a cross-functional process for source, make and deliver in the commercial sector. Definitions.
Supply Chain Improvement is based on the work that we completed with an Arizona State University Operations Research team to determine the Supply Chain Index. Aligned Metrics. How do you balance the trade-offs between source, make and deliver? Supply Chain Design. Active, and intentional, design of the supply chain.
The source data for the analysis comes from Ycharts.). We selected these metrics based on correlation work with Arizona State University in 2012. Long-term balance sheet improvement requires a focus on a balanced scorecard and the alignment of sell, deliver, make, and source to drive value. Celebrating Success.
It is important to benchmark forecast accuracy and similar supply chain metrics against your peers. Increasingly, forecasts are being improved by leveraging outside data sources rather than merely relying on a company’s internal historical shipment data. It turns out the Super Bowl happened on February 12 th in Glendale, Arizona.
I have taken myself off the road to write the book Metrics That Matter. We often find that companies have better performance in the management of regional supply chains where the sources of supply are in the same market versus the management of products across borders. It is a slow week. Most of my friends are on vacation.
I have learned that supply chain systems are more complex than I originally thought, and that the relationships between supply chain metrics are nonlinear. These tools allow us to look at sell, source, make, and deliver together. After three years of research, I have just refined the methodology to start to pull the trends.
To demonstrate, one California autonomous vehicle company, TuSimple, tested the efficacy of long-haul driverless vehicles in a recent trek from Nogales, Arizona to Oklahoma City, shaving 10 hours (42%) off of what would otherwise be a 24-hour trip. In a word, it’s data. Keep Your Eyes on the Road.
Pick five-to-seven balanced metrics and hold all functions accountable to these corporate metrics. Next week, in Arizona, 120 supply chain leaders will be meeting to network on the Future of Supply Chain 2030. Communicate the balanced scorecard for the team through clear leadership communication and stay the course.
Walmart previously scaled back its drone deliveries in 2024, when it ended the service in Utah, Arizona and Florida, in favor of focusing on remaining operations in Dallas-Fort Worth, Arkansas and Virginia. Eligible products include fresh produce, household essentials and various snack foods.
I began analyzing correlations of groups of metrics to market capitalization and found that the most significant correlation was between market capitalization and growth. Initially, I worked with Arizona State statistics professors and graduate students to correlate market factors to 2006-2012 data.) I hope to see you there!
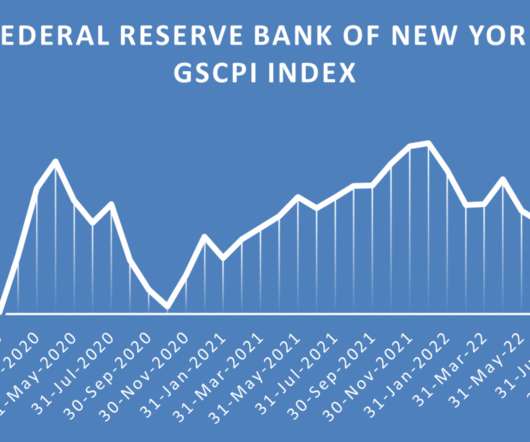
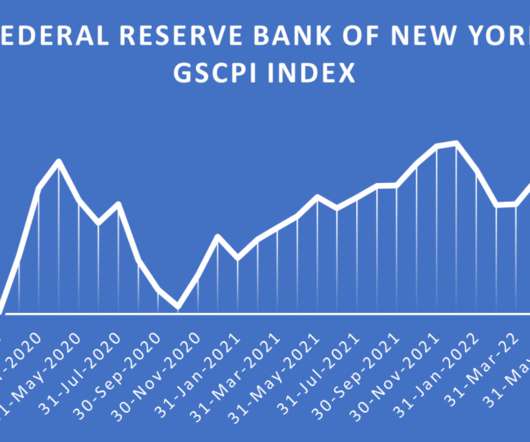
28% of global retailers have tried to find alternative sourcing options due to supply chain issues (RetailNext, 2020). Source: Consultancy.UK. Image source: Fortune. Within a week of Russian troops crossing into Ukraine, the benchmark for thermal coal prices reached a record high of $446 per metric ton. Consultancy UK).
The selection of metrics is based on prior work with Arizona State University to understand which metrics, in combination, correlate to market capitalization and price to book value. The processes of make, source, and deliver reports to a common leader in only 40% of businesses. Why do we spend four months doing this?
February 2025 Logistics Managers Index Report The Logistics Managers Index Report is compiled by researchers at Arizona State University, Colorado State University, Rochester Institute of Technology, Rutgers University and the University of Nevada Reno , and in conjunction with the Council of Supply Chain Management Professionals (CSCMP).
The network senses, translates, and orchestrates market changes (buy- and sell-side markets) bidirectionally, across multiple tiers, with near real-time data to align sell, deliver, make, and sourcing organizations outside-in. To build this model, I flew to Arizona to develop it with Carol Ptak of the Demand-Driven Institute.
When I was Materials Manager at Maricopa County, Arizona, the second largest county in the country, I introduced Vendor Managed Inventory. Supplier Quality Management: What it is, 5 Key Metrics to Know & a 4 Step Supplier Evaluation Process. These metrics should be reviewed frequently to ensure supply chain success.
The Logistics Managers Index Report® , compiled by researchers at Arizona State University, Colorado State University, Rochester Institute of Technology, Rutgers University and the University of Nevada Reno , and in conjunction with the Council of Supply Chain Management Professionals (CSCMP) , reported a September value of 61.4,
not only described as a “ significant rate of contraction ,” but also the first time that this particular metric has reached such a low level. Supply Chain Matters highlights this week’s release of the U.S. Logistics Managers Index (LMI) that dropped to an all-time low for May 2023. Consequently, transportation prices reportedly declined 8.9
According to the June report summary , the primary driver of the latest decline was the inventory metric, which reportedly contracted 6.5 Consequently, the warehousing capacity metric increased a reported 6.8 Both metrics contributed to the overall contraction in the LMI along with contracting price levels for transportation.
The Logistics Managers Index Report ®, compiled by researchers at Arizona State University, Colorado State University, Rochester Institute of Technology, Rutgers University and the University of Nevada Reno , and in conjunction with the Council of Supply Chain Management Professionals (CSCMP) , reported a July 2022 value of 60.7,
The Logistics Managers Index Report ®, compiled by researchers at Arizona State University, Colorado State University, Rochester Institute of Technology, Rutgers University and the University of Nevada Reno , and in conjunction with the Council of Supply Chain Management Professionals (CSCMP) , reported an April 2022 value of 69.7
” — William Verdini, associate professor and chairman of the Supply Chain Management Department at Arizona State University’s Carey School of Business, as quoted in The Importance of Education in Supply Chain Management , Reliable Plant; Twitter: @NoriaCorp.
Too few companies understand the differences between syndicated data sources and the use of channel data. In addition, my new book Metrics that Matter is designed to help build cross-functional teams. We are very early in our understanding of outside-in processes. No doubt about it. They are based on flows.
We organize all of the trending information in your field so you don't have to. Join 102,000+ users and stay up to date on the latest articles your peers are reading.
You know about us, now we want to get to know you!
Let's personalize your content
Let's get even more personalized
We recognize your account from another site in our network, please click 'Send Email' below to continue with verifying your account and setting a password.


Let's personalize your content