This site uses cookies to improve your experience. To help us insure we adhere to various privacy regulations, please select your country/region of residence. If you do not select a country, we will assume you are from the United States. Select your Cookie Settings or view our Privacy Policy and Terms of Use.
Cookie Settings
Cookies and similar technologies are used on this website for proper function of the website, for tracking performance analytics and for marketing purposes. We and some of our third-party providers may use cookie data for various purposes. Please review the cookie settings below and choose your preference.
Used for the proper function of the website
Used for monitoring website traffic and interactions
Cookie Settings
Cookies and similar technologies are used on this website for proper function of the website, for tracking performance analytics and for marketing purposes. We and some of our third-party providers may use cookie data for various purposes. Please review the cookie settings below and choose your preference.
Strictly Necessary: Used for the proper function of the website
Performance/Analytics: Used for monitoring website traffic and interactions
To build an outside-in model, and use new forms of analytics, we must start the discussion with the question of, “what drives value?” ” Traditional planning models optimize functional processes to improve cost and customer service. You are right. The answer is not th e Gartner Top 25.
In follow-up qualitative interviews, one of the largest issues with organizational alignment was metric definition and a clear definition of supply chain excellence. In my post Mea Culpa, I reference my work with the Gartner Supply Chain Hierarchy of Metrics. Error is error, but is it the most important metric? My answer is no.
Solvoyo has a metric they call the user acceptance rate. This metric measures the percentage of time the planners accept replenishment, transportation, or inventory plans as they are without any change in the timing of the delivery or the quantity to be delivered. You don’t act on a forecast; you act on what you purchase.
Reason #6 Not effectively managing inventory. Reason #9 Relentless pursuit of one supply chain metric at the expense of other metrics. Imagine that your child brings home their report card and it’s a mix of good and fair grades. One example that I’ve seen several times is around inventory targets.
Most of the business networks were hollowed out by venture capitalists or purchased by opportunists. ” My problem is that we move through these hype cycles with little accountability for spending and with a major opportunity cost to not redefine work. Or that a focus on cost reduction can actually undermine value creation?)
Procurement and supply chain management are often used interchangeably—but in practice, the lines between them can blur in ways that create real friction. Misaligned priorities, siloed systems, and unclear ownership can directly impact key performance indicators like cost savings percentage and procurement cycle time.
These steps include sourcing and receiving inventory, storing inventory, order processing, picking and packing an order, shipping the order, and returns management. Standard sizes and categorizations play a crucial role in determining the costs associated with shipping products that meet standard criteria in fulfillment centers.
Enterprise procurement leaders are under more pressure than ever—juggling cost control, compliance, supplier risk, and internal complexity, all while trying to modernize outdated systems. AI, automation, and generative tools are redefining efficiency, allowing procurement teams to move from reactive to proactive decision-making.
A disruption at any point in the global logistics network including the average of 12 touch points from shipment packaging to final delivery can prove disastrous for profits, service levels, customer loyalty, and other key metrics. With the global e-commerce market predicted to reach $8.1 billion to $23.07
Returns Management and Integration With 35% of online purchases being returned, predominantly to physical stores, retailers are grappling with the ripple effects on inventory management. Early adopters of these integrated platforms report significant improvements in inventory turnover and reduction in stockouts.
At each company, there is a relationship between the metrics of growth, margin, inventory, customer service, and asset strategy. For the purpose of this article, I will use Return on Invested Capital (ROIC) as the proxy metric to discuss asset utilization.) Understanding this relationship requires modeling. (A
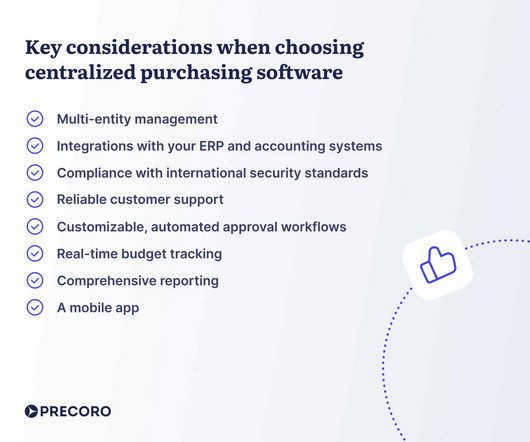
For most CPOs and CFOs, deciding on the right purchasing setup — centralized or decentralized — is no small task. Each model has its perks, and choosing the best fit can feel like walking a tightrope. Keep reading to learn: What is centralized purchasing? What is centralized purchasing?
Supply chain efficiency is the cornerstone of success and involves the effective management of processes, resources, and technologies from procurement to production, transportation to warehousing. In the automotive sector, manufacturers are simultaneously reducing inventorycosts and delivery times.
It is crucial for organizations to understand the importance of Purchase Order collaboration to effectively manage their direct spend, optimize operations, and mitigate risks. From natural disasters to geopolitical tensions and the ongoing COVID-19 pandemic, supply chains have been significantly impacted.
Traditionally, procurement has been a process weighed down by manual tasks, fragmented systems, and endless paperwork. Today, procurement is undergoing a transformation. While procurement teams have long worked to add strategic value, Artificial Intelligence (AI) amplifies their impact.
Supply shortages resulting in empty shelves or parking lots of WIP inventory represent a spectre causing supply chain leaders to reconsider supply chain inventory practices. Opinion of just-in-time (JIT) as a practice has taken a battering and inventory is rising. Is supply chain inventory the problem?
Picture this: You’re a warehouse manager, and with a few taps on your smartphone, you instantly know the exact location and quantity of every item in your inventory. That’s not science fiction—it’s the power of mobile inventory management. Ready to turn your inventory from a headache into a strategic asset?
Even more impressive, lost sales due to stockouts can decrease by up to 65%, while inventory reductions of 20% to 50% are possible. This advanced analysis allows businesses to predict promotional lift with unprecedented accuracy, ensuring optimized production schedules and inventory positioning through sophisticated supply planning.
Interview for Metrics That Matter. My kitchen table is piled high with interviews for the upcoming book, Metrics That Matter. He is responsible for manufacturing, procurement, supply chain planning, logistics, quality, social responsibility and final product engineering. ” Supply Chain Leader. I am behind. The heat is on.
GEP and the North Carolina State University (NCSU) Supply Chain Resource Cooperative surveyed supply chain, procurement and IT professionals across a range of industries to gain insight into their priorities and strategies regarding supply chain resilience and optimization. Alex Zhong, Director Product Marketing at GEP.
If you’re evaluating procurement technology or exploring ways to drive more value from existing systems, chances are you’re looking beyond tactical fixes – you want a smarter, scalable strategy. Misaligned priorities across finance, legal, and procurement create friction that delays decision-making and reduces impact.
Analytics and business intelligence (BI) are no longer optionaltheyre essential. They integrate, align, and activate data across the business to drive better, faster decisions unlike legacy reporting tools that can’t. Flexible Delivery Options Interactive dashboards, scheduled reports, alerts, mobile access, and more.
Wikipedia In 2014, I was exploring methods to publish what is now the Supply Chains To Admire report. The use of orbit charts allowed me to see the patterns of performance at the intersection of metrics over time. We purchase data from Y charts. (A We have archived corporate reporting from Y charts for 1982-2023.
As an old gal, with over forty-years of supply chain experience, writing this report for ten years taught me many lessons. I find in the orbit chart analysis that 45% of companies in the report are unconsciously incompetent. An average margin of 21% with inventory turns of 1.58 Wrap-up Spend time with the report.
How aligned do you believe your organization is to drive these metrics? P&G did not appreciate the work Gilette accomplished on form and function of inventory and using market signals. As a result, the company’s performance at the intersection of margin and inventory turns was circular for the past decade.
There is so much data, and to make use of it, we need to use data mining and analytics to drive meaningful insights that can be put to some good use. ABC Analysis for Inventory Planning : Clustering products that behave similarly highlights issues, challenges, and opportunities for serving customers better.
I see a preponderance of reports and white papers that have lots of pages but say little. Optimization engines to improve functional metric performance resulted in an exploding number of planners. Rolling up a perpetual inventory signal takes eleven hours. days to get a perpetual inventory signal and 2.2 Back to John.
Understanding how your Procurement and Supply Chain KPIs are performing isn’t just a nice-to-have; it’s essential for survival and growth. Is inventory bloating your costs? Why You Need Visibility of Supply Chain and Procurement KPIs? Struggling with the true cost of ownership or serving your customers?
Inventory is the lifeblood of any manufacturing business. Get it right, and youve got happy customers and streamlined costs. Striking the perfect balance between available stock and cost efficiency is key. Tracking inventory flow and performance across your supply chain is a must. But what exactly should you measure?
Throughout the supply chain, the use of metrics to track and understand processes provides an invaluable resource for ensuring increased production and customer satisfaction. What Distribution Center Metrics Need Tracking? However, the most important metrics can be categorized into the following eight areas. On-Time Shipping.
By embedding analytics across logistics, sourcing, and fulfillment, businesses gain the visibility and foresight needed to stay competitive.Analytics-driven leadership is no longer a luxury; it’s the foundation of operational survival in todays volatile business environment. Analytics allows organizations to move beyond intuition.
BOSTON, February 16, 2022 : ToolsGroup , a global leader in supply chain planning and optimization software, has partnered with Planalytics to integrate their weather-driven demand (WDD) analytics with ToolsGroup’s retail planning solutions, enabling customers to isolate, measure, and manage the influence of weather on their businesses.
What is Vendor Relationship Management (VRM) and Why It’s Essential for Your ERP and Inventory Software? Strong vendor relationships are critical for business success, especially when it comes to managing inventory and procurement. By automating this process, you reduce errors and improve financial reporting accuracy.
The past few years have created a lasting impact on the way business is conducted, driving many companies to analytics to gain the visibility they need to control and optimize key processes. The Basics of Procurement KPIs. To accomplish this, our clients rely on the built-in data hub of our Stratum reporting application.
The consulting team pitches a theme–vision of supply chain best practices, big data analytics, or demand-driven value networks– to the executive team, and a new project is initiated. It was also the preference of the consulting partners because the projects were longer, more costly and better aligned with the consulting model.
In the realm of efficient procurement management, understanding the various types of procurementreports becomes paramount. These reports serve as navigational tools, offering insights into different facets of the procurement process.
Inventory, in this time of uncertainty, is the organization’s most important buffer to protect against variability. However, organizations are not good at managing inventory. Cash-to-Cash Metrics. Cash-to-cash is a compound metric: (Days of Receivables+Days of Inventory)-Days of Payables=Cash Conversion Cycle.
This blog explains The Key MRP Metrics in Supply Chain whcih every supply chain professional in Manufacturing or Distribution Businesses. The metrics that underpin MRP could be described as the balls in this juggling act. This article takes an in-depth look at the crucial metrics every supply chain professional needs to know.
To monitor supply chain performance, stakeholders of successful companies typically define supply chain metrics that are relevant to the given business and track these KPIs regularly. By setting benchmarks for metrics, analysts can recognize unsettling trends and take preventive measures on time.
Days Sales of Inventory (DSI) is a key measure to help you understand how efficient your inventory management is. Here explain what DSI is, how to use it, and why it’s crucial to track this metric in your business – whether you’re a retailer, manufacturer, wholesaler or distributor. How do you calculate Average Inventory?
We have been taught, as supply chain leaders, that over the last decade supply chain processes have improved costs, shortened cycle times, improved customer service and decreased inventory. Based on our recent research, we find that only 1% of process-based companies are making progress on both operating margins and inventory.
In today’s dynamic market, procurement is far more than just a buying and purchasing center. Our latest e-book, “ Is Manufacturing Missing Out On Procurement’s Value Add? Our latest e-book, “ Is Manufacturing Missing Out On Procurement’s Value Add? Here are some key insights from the e-book.
Analytical techniques like linear programming can create the mathematically “optimal” plan, but these methods must be implemented well to avoid creating other challenges. Fusing analytical approaches improves the math behind optimization, but to avoid highly-efficient silos it should be paired with concurrent planning.
We organize all of the trending information in your field so you don't have to. Join 102,000+ users and stay up to date on the latest articles your peers are reading.
You know about us, now we want to get to know you!
Let's personalize your content
Let's get even more personalized
We recognize your account from another site in our network, please click 'Send Email' below to continue with verifying your account and setting a password.


Let's personalize your content