This site uses cookies to improve your experience. To help us insure we adhere to various privacy regulations, please select your country/region of residence. If you do not select a country, we will assume you are from the United States. Select your Cookie Settings or view our Privacy Policy and Terms of Use.
Cookie Settings
Cookies and similar technologies are used on this website for proper function of the website, for tracking performance analytics and for marketing purposes. We and some of our third-party providers may use cookie data for various purposes. Please review the cookie settings below and choose your preference.
Used for the proper function of the website
Used for monitoring website traffic and interactions
Cookie Settings
Cookies and similar technologies are used on this website for proper function of the website, for tracking performance analytics and for marketing purposes. We and some of our third-party providers may use cookie data for various purposes. Please review the cookie settings below and choose your preference.
Strictly Necessary: Used for the proper function of the website
Performance/Analytics: Used for monitoring website traffic and interactions
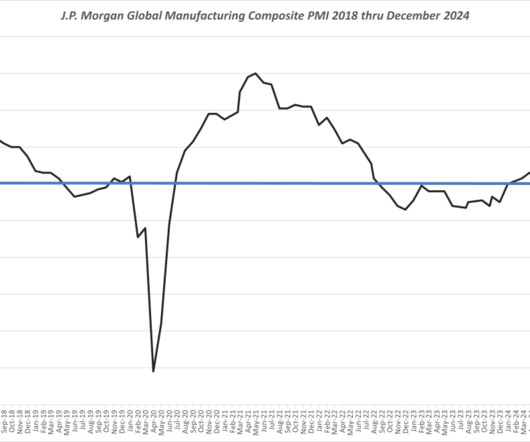
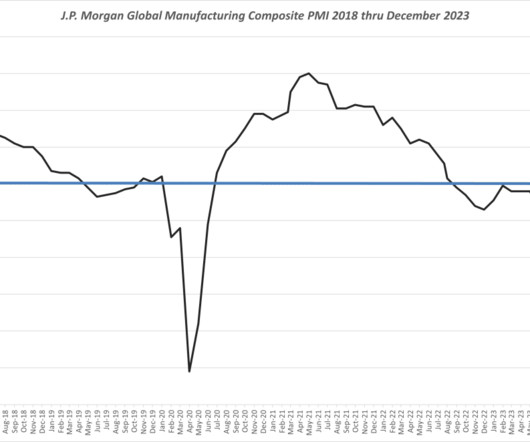
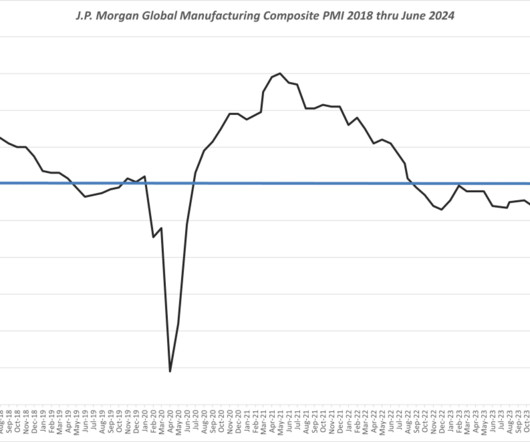
Source: Various published PMI reporting, 2024 and compiled by Ferrari Consulting and Research Group LLC This same global wide indicator ended 2023 at a value of 48.8 The consumer goods sector was contrasted with output rising for the seventeenth consecutive month. and thus 2024 provided a 0.8 On a year-over year basis, this index rose 1.1
Exclusive: Why China's ultimatum to Myanmar rebels threatens global supply of heavy rare earths The global supply of heavy rare earths hinges in part on the outcome of a months-long battle between a rebel army and the Chinese-backed military junta in the hills of northern Myanmar. has a simple strategy to deal with U.S.
The open question is whether June’s expansion was related solely to inventory pre-loading prior to the imposition of considerably higher global wide tariff levels. With the tariff drags still building, however, and some sector tariffs yet to be implemented if at all, it remains to be seen how long this resilience will last.” value for May.
The cost of recovery from a disruption in procurement management depends on factors such as supply source, volume, manufacturing location and inventory. Supply chains that rely on a single source are now more likely to experience disruptions. Rushing the Launch of New Systems and Protocols.
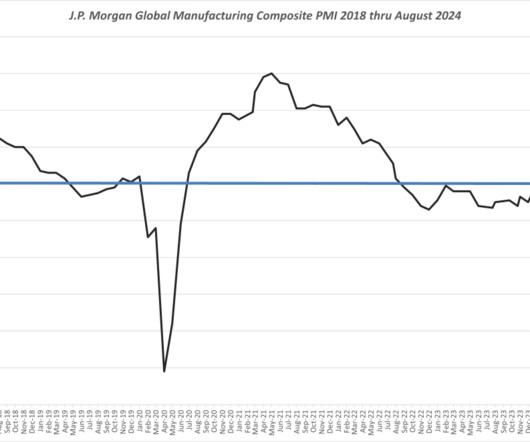
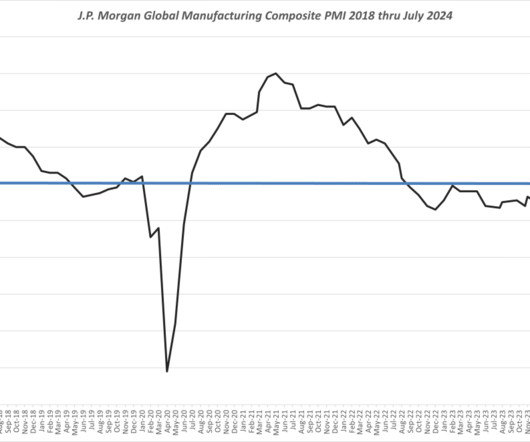
Also highlighted was that purchasing activity, stocks of purchases and finished goods inventories collectively rose in July. The bottom three were listed as Poland , Taiwan and Myanmar. . The top three regions exhibiting PMI growth were that of India, Australia and the Netherlands. Select Regional Highlights. United States.
Business costs will rise for those who are sourcing some or most of their raw materials or goods from China. But it’s already happening as wholesalers, distributors, and importers source alternatives from other countries and place tentative orders. For example, leather goods, woodcrafts and furniture from Myanmar and Indonesia.
To anticipate and respond to high customer demand, a modern Transportation Management System (TMS) needs to optimize inventory allocation. By consolidating at the source, several shipments can be combined into one, thereby reducing the number of shipments even before the shipments arrive at the Logistics Service Provider (LSP).
However, there must be consensus within the organisation about definitions and the right source of information for important reports. Supply Chain Media and consultancy firm Involvation have developed this checklist to provide insight into the added value and the potential of your current S&OP process. Anticipate. Marshall Islands.
The April report was headlined with India’s manufacturers increasing input inventories to near record pace to prepare for increased output. Other Asian Nations The S&P Global ASEAN Manufacturing PMI is a compilation of seven ASEAN nations- Indonesia, Malaysia, Myanmar, the Philippines, Singapore, Thailand, and Vietnam.
These investments include supplier order commitments, inventory building and capital expenditures. Other Asian Nations The S&P Global ASEAN Manufacturing PMI ® is a compilation of seven ASEAN nations- Indonesia, Malaysia, Myanmar , the Philippines, Singapore, Thailand , and Vietnam. compared to an April value of 42.5.
Morgan indicated in part: “ An improving orders-to-inventory ratio and upward momentum in both new export business and employment all suggest the underlying dynamics of the manufacturing sector are also moving in the right direction. Contrasting Reporting for U.S. Manufacturing Among the two reported PMI reports relative to U.S.
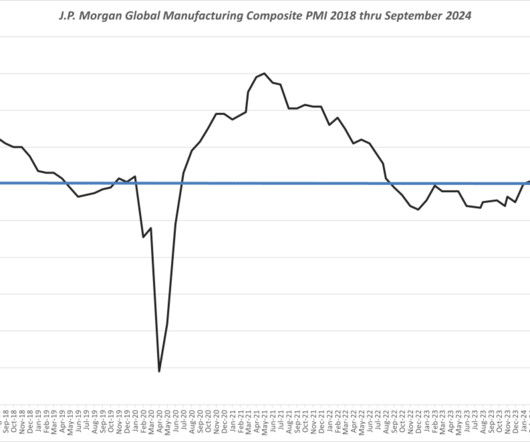
Source: S&P Global Intelligence and compiled by The Ferrari Consulting and Research Group 2024 Select Regional and Country Highlights Eurozone Manufacturing Contraction Continues The HCOB Eurozone Manufacturing PMI® report for September was headlined with euro area manufacturing activity falling at its steepest pace thus far in 2024.
From our lens, the August data further reflects ongoing shifts in production sourcing within specific industry sectors. The top producing nations by notion of highest PMI levels were noted as India, Indonesia, Myanmar, Greece and Russia. The inventories index decreased 2.1 Continued Contraction Levels for the U.S.
Source: JP Morgan and S&P Global Market Intelligence, 2024 Select Regional and Country Highlights India The HSBC India Manufacturing PMI® August report was headlined with India based manufacturers signally substantial but softer increases in new business and production levels. in July to 51.1
A continued subdued product demand environment and added caution reportedly led to a decline in overall purchasing activity, lower levels of inventory and improved supplier delivery times. Pre -and post inventory levels, however, fell at a weaker rate with European manufacturers reportedly being less aggressive in de-stocking efforts.
The pivotal turning point in the inventory cycle is a key factor for initiating a recovery. This index is a compilation of seven ASEAN nations- Indonesia, Malaysia, Myanmar, the Philippines, Singapore, Thailand, and Vietnam. Declines in the manufacturing sector were noted for Myanmar , Thailand , and Malaysia.
The bottom three were listed as Poland , Taiwan and Myanmar. Similarly, raw material inventories are accumulating due to the sudden and unexpected drop in production volumes.”. . Excess inventory levels now remain a more cogent concern particularly among retail industry supply networks.
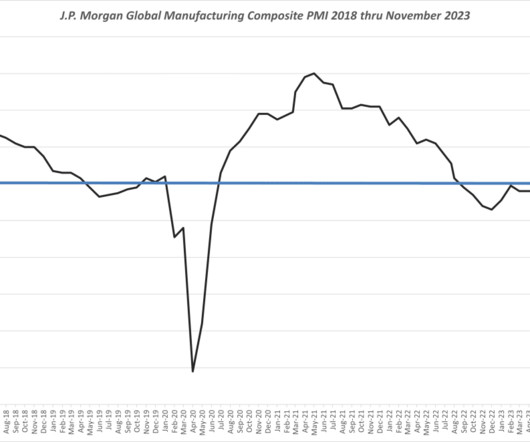
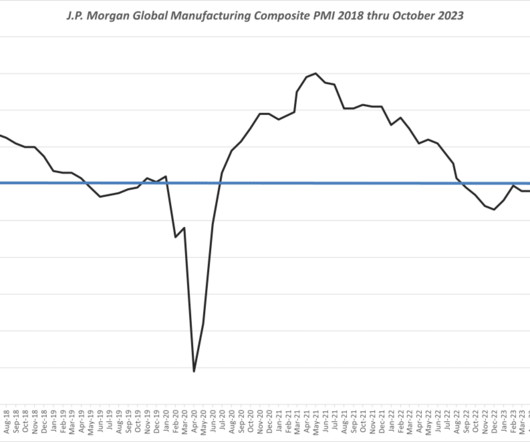
With output contracting for the fifth consecutive month and business optimism reportedly dipping to an 11-month low, the report pointed to cutbacks occurring in manufacturing employment, purchasing and inventory levels globally. The October PMI reported value fell to a three-month low of 48.8, down from the 49.2 value reported for September.
That stated, inventory pressures coupled with higher demand have reportedly led to lengthening lead times for the country’s manufacturers. These factors collectively add to uncertainty relative to the second half, particularly related to inventory management and added disruptive related risks. All rights reserved.
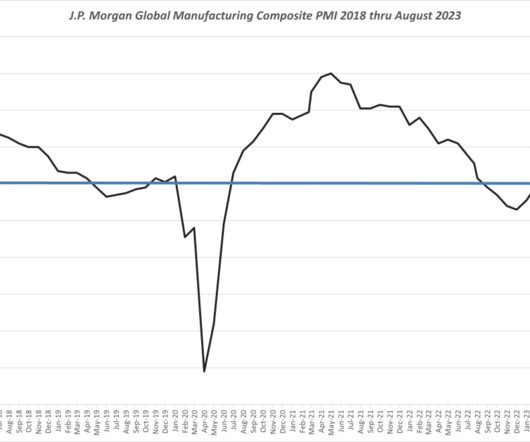
Business confidence reportedly weakened for the fourth month running along with further declines in purchasing activities and inventories. The July report headlines included a steeper reduction in new order flows, in output and in declining manufacturing employment levels. This particular index rose to a two-year high of 52.1
Quicker declines in finished goods inventories and a softer reduction in pre-production stocks were noted. This index is a compilation of seven ASEAN nations- Indonesia, Malaysia, Myanmar , the Philippines , Singapore , Thailand , and Vietnam. Further reductions in manufacturing employment were reported. and France being 43.1.
Inventory purchases and manufacturing employment each decreased. Source: S&P Global Intelligence and JP Morgan, 2024 Select Regional and Country Highlights United States The S&P Global U.S. Improved business conditions in China and the rest of Asia were contrasted with a deepening downturn across the eurozone region.
Crisis Response – At the outset of the crisis, it’s easier to visualise a horizontal and linear supply chain with the 4 flows disrupted and adversely affecting the Core Supply Chain Functions, of Planning, Sourcing, Production, Distribution, last mile Deliveries and returns management or reverse logistics. Diversification.
Noted was that India, Ireland and the Philippines experienced the largest production and PMI growth levels in April while Mexico, Canada, Myanmar and the United Kingdom experienced the highest overall production contractions. Sources: S&P Global Intelligence and various other reported PMI indices. in April, a 1.5
With the Februarys PMI reporting, there are indications of the post Lunar New Year ramp-up of global production levels to replenish inventories. Prices growth accelerated due to tariffs, causing new order placement backlogs, supplier delivery stoppages and manufacturing inventory impacts. up from 50.4 reported for January.
We organize all of the trending information in your field so you don't have to. Join 102,000+ users and stay up to date on the latest articles your peers are reading.
You know about us, now we want to get to know you!
Let's personalize your content
Let's get even more personalized
We recognize your account from another site in our network, please click 'Send Email' below to continue with verifying your account and setting a password.


Let's personalize your content