This site uses cookies to improve your experience. To help us insure we adhere to various privacy regulations, please select your country/region of residence. If you do not select a country, we will assume you are from the United States. Select your Cookie Settings or view our Privacy Policy and Terms of Use.
Cookie Settings
Cookies and similar technologies are used on this website for proper function of the website, for tracking performance analytics and for marketing purposes. We and some of our third-party providers may use cookie data for various purposes. Please review the cookie settings below and choose your preference.
Used for the proper function of the website
Used for monitoring website traffic and interactions
Cookie Settings
Cookies and similar technologies are used on this website for proper function of the website, for tracking performance analytics and for marketing purposes. We and some of our third-party providers may use cookie data for various purposes. Please review the cookie settings below and choose your preference.
Strictly Necessary: Used for the proper function of the website
Performance/Analytics: Used for monitoring website traffic and interactions
In today’s architectures and functional metrics, value optimization does not exist. And, when procurement and tactical planning operate in isolation, there is no decision support framework to guide the trade-offs especially when the functions are tethered to different and conflicting metrics. You are right.
Yet in EY’s research, they report that “nearly all supply chain leaders (97%) say that their organizations are currently facing challenges as it relates to supply chain metrics and that challenges come from a lack of integrated data and cross-functional metrics being in conflict with each other, among others.
A lack of standardized ESG metrics across industries and regions makes it challenging to consistently evaluate and compare supplier performance. Finally, companies are focusing on linking ESG outcomes such as emissions reductions, labor practice improvements, or waste minimization to measurable operational and business metrics.
The DOE is still issuing large federal loans to startup companies, Novonix a synthetic graphite startup just received a $755 million loan to support its mission and reach its goal of producing 31,500 metric tonnes of synthetic graphite.
This buyers guide will cover: Review of important terminology, metrics, and pricing models related to database management projects. Download ZoomInfo’s latest data-driven eBook aimed to help marketing leaders understand the best practices around choosing a B2B contact data provider.
However, as carbon taxes and emissions reporting requirements continue increasing, supply chain professionals face mounting pressures from inside and outside their organizations to measure and improve performance against new, nebulous sustainability metrics. Freight transportation makes up over 10% of total global carbon emissions.
Metrics like carbon emissions, waste diversion rates, worker safety incidents, and supplier compliance scores provide clear indicators of success and help build trust with stakeholders. Measuring Progress and Building Trust Transparency is essential in sustainability efforts.
With freight transport accounting for a significant share of global emissions, efforts to improve logistics now extend beyond operational metrics to include resilience, regulatory compliance, and climate performance. The global freight sector faces growing pressure to balance cost-efficiency with environmental responsibility.
Functional Metrics and the Lack of Alignment to Strategy. Few companies are clear on the number of supply chains they operate, design the rhythms and cycles of each, and align metrics to the strategy. The industry is not clear on desired outcomes. Clarity on Value. Guess what? It doesn’t. These two reports are coming soon.
We’ll explore the vital signs of project success through the lens of the “iron triangle” metrics, using deliverables as tracers. This session is your guide to evaluating the health of your projects through Waterfall and Agile practices like Scrum and Kanban.
Public Reporting: Publishing sustainability reports and ethical compliance metrics to highlight progress and areas of improvement. Key transparency initiatives include: Supply Chain Mapping: Using digital tools to trace the journey of products from raw materials to finished goods.
To improve S&OP data quality must be improved, performance metrics must be rigorously defined, and company goals and objectives must be aligned to ensure there are clear roles and expectations. The ARC Advisory Group will soon begin updating the annual Supply Chain Planning Market Analysis.
Solvoyo has a metric they call the user acceptance rate. This metric measures the percentage of time the planners accept replenishment, transportation, or inventory plans as they are without any change in the timing of the delivery or the quantity to be delivered.
We’ll examine the key components of efficient supply chains, explore essential performance metrics, and uncover the fundamental drivers that influence efficiency. Efficient supply chains strengthen collaborative relationships through automated communication systems and shared performance metrics.
Speaker: Ketan Jahagirdar - Sopheon’s Director of Product Management
Join us for a deep dive into the world of financial strategy, as we dissect key metrics that drive CFOs and business leaders’ investment decisions. Empower yourself as a project manager with insights that directly influence the financial landscape and strategic direction of your organization!
Set Measurable Goals: Establish clear targets for emissions reduction, energy efficiency, and sustainability metrics. Strategies for Implementation To ensure a successful transition, companies should adopt targeted strategies: 1. Regularly review progress to ensure accountability and alignment with objectives.
The Logistics Data Challenge The logistics sector is awash with data, from shipment volumes and freight rates to sustainability metrics and supplier performance. By focusing on purpose-driven data, companies can avoid wasting resources on metrics that are not utilized. Prioritize Critical Data Sets Not all data is equally valuable.
The research methodology for the Supply Chains to Admire compares the performance of a company against its industry peer group for the metrics of Year-over-Year Revenue Growth, Inventory Turns, Operating Margin, and Return on Capital Employed (ROCE). For 80% of industries, the supply chain metrics represent more than 40% impact on value.
Combine data from: Enterprise Resource Planning (ERP) systems Transportation Management Systems (TMS) Warehouse Management Systems (WMS) Internet of Things (IoT) sensors Supplier portals Customer relationship management systems (CRM) Performance Metrics and KPIs Performance metrics measure how effective your supply chain is.
Many rely on inappropriate metrics borrowed from other departments, wasting resources and overlooking valuable opportunities. This guide outlines why innovation metrics are hard to track and offers a framework for creating effective KPIs.
Metrics must reflect the new priorities. These tools dont need to cover the entire network to be useful. Piloting them in high-risk or high-margin areas is often the best way to prove their value. Cultural alignment is just as important. Resilience needs to be part of how success is measuredalongside efficiency, not in place of it.
Data-Driven Insights: Provides valuable insights into shipping costs and performance metrics to optimize operations. Dedicated Support: Offers expert support to guide you through the setup and implementation process.
Boards are demanding resilience—not as a buzzword, but as a line-item performance metric. In “Tariffs Are the New Normal: Boardrooms Are Finally Demanding a Pivot to Real-Time Supply Chain Orchestration” , Kinaxis’ Mark Morgan explains how tariffs have become a constant, catalyzing a shift from batch planning to real-time orchestration.
The issue is that when companies optimize functional metrics, they throw the supply chain out of balance and sub-optimize value. Using the objective function of market capitalization/employee, we find that 40-70% of value can be modeled using the four metrics of growth, Return on Capital Employed (ROCE), inventory turns, and operating margin.
Download this eBook to get the skinny on OTIF metrics, identifying the root cause of issues, and how to improve your scores! Information on Walmart’s On-Time In-Full program is scattered, so we’ve put together everything you need to know about OTIF.
Use metrics like lead-time sensitivity, margin contribution, and order volume to prioritize. It should be woven into how the supply chain is run. Key components include: 1. Identify What’s Critical Figure out what can’t go down without serious consequences, suppliers, routes, systems, SKUs, or even customers.
This integration includes tracking individual components and collecting data on environmental impact, including sustainability metrics such as carbon footprint and recyclability. Tracking key performance metrics and conducting regular audits help identify areas for improvement and ensure ongoing compliance with regulatory requirements.
Timestamps (00:00:04) A Trillion Dollars in Freight Transactions (00:00:16) Guest Background (00:00:50) DAT Freight Marketplace (00:01:36) DAT Analytics for Brokers and Carriers (00:06:31) Economies of Scale for Shippers (00:09:17) FedEx Exec on Logistics Puzzle (00:11:59) Industry Partnerships (00:16:41) Trillion Dollars in Freight Transactions (00:20:32) (..)
Functional metrics align to bonus incentives, but progress in supply chains remains evasive. Automating functional metrics like OEE or PPV or reducing functional costs with agentic AI accelerates waste by throwing the supply chain out-of-balance. In the building of the global multi-national organization, culture is fragile.
2022 was the year of corporate commitments to sustainability, and 2023 is the year where promises become proposals, mission statements become metrics, and aims become actions. We need to act now by making the right decisions. New regulations have been set regarding the corporates, and they must comply.
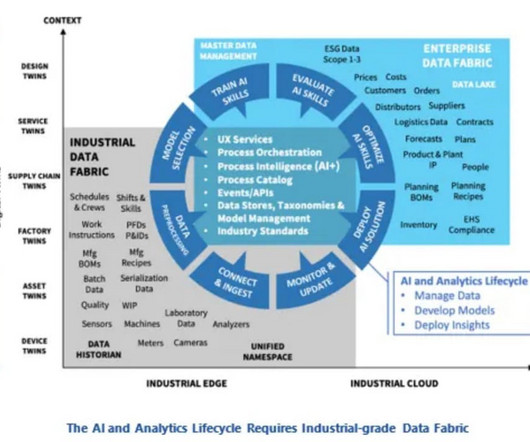
Not all the transactional data, just the data required to calculate a metric or make a decision. So, we deploy an agent on an SAP environment. The agent selectively pushes data to the Aera data model.” These agents help to ensure the core parameters in planning, like lead times, are accurate and up to date.
Conduct Comprehensive Financial Analysis Demonstrate tangible ROI by highlighting: Projected revenue improvements Cost savings Return on investment metrics Performance during market volatility Real-world data shows probabilistic forecasting can improve forecast accuracy by 15-25% compared to traditional methods.
billion rate data points monthly to provide the most comprehensive view of the market, helping you identify savings opportunities and make data-driven decisions.
Fleet Telematics and Driver Behavior Fleet operators collect telematics data across engine metrics, route adherence, and driver behavior (e.g., The data is used not only for response but for audit and documentation purposes in the event of spoilage claims or carrier disputes. acceleration, idling, braking).
Download the report to learn more about: The strategies and technologies ABM marketers are using to increase ABM successes Why it’s important to shift toward more targeted, personalized assets How marketers are meeting buyers' demands for self-service journeys Which metrics and marketing KPIs matter across the ABM funnel
Form and socialize your own hierarchy of metrics. Here is the metrics framework that I am using at present in my outside-in classes. For example, don’t focus on forecast error. Instead, analyze demand flow characteristics by demand stream to evaluate Forecast Value Added (FVA), forecastability, and bullwhip impact.
Protecting sensitive data—such as vehicle locations, driver information, and operational metrics—requires rigorous cybersecurity measures. Additionally, the increased connectivity that enables real-time data transmission also raises cybersecurity risks.
Measuring and Improving Procurement Strategy Performance A successful procurement strategy is data-driven andsupports continuous improvement across key metrics such as cost savings, supplier performance, delivery reliability, and ESG compliance. Platforms should support structured collaboration from intake management to invoice automation.
Create an index of supply chain metrics. If not already in place, the first step is to create an index of supply chain metrics that help quantify and track interdependencies across the supply chain. It is important to select only those metrics that communicate gaps and how fast they are growing.
Just by embedding analytics, application owners can charge 24% more for their product. How much value could you add? This framework explains how application enhancements can extend your product offerings. Brought to you by Logi Analytics.
Courses and modules focused on data analytics, forecasting, and performance metrics equip students with the skills needed to leverage data in optimizing supply chain operations. Similarly, performance metrics courses can guide learners in establishing key performance indicators (KPIs) to monitor and improve supply chain efficiency.
beef from 1,000 to 13,000 metric tons , removing the 20% tariff within that limit. Further details on derivative product eligibility and quota volumes have not been published. Agriculture and Ethanol The UK has raised its import quota for U.S. Imports exceeding this quota remain subject to standard rates.
Measuring and Improving Procurement Strategy Performance A successful procurement strategy is data-driven andsupports continuous improvement across key metrics such as cost savings, supplier performance, delivery reliability, and ESG compliance. Platforms should support structured collaboration from intake management to invoice automation.
These systems also support phased implementation, allowing you to start with high-priority processes, train staff during regular work hours, deploy your wireless infrastructure before software rollout, maintain parallel systems during the initial transition, and closely monitor performance metrics.
We organize all of the trending information in your field so you don't have to. Join 102,000+ users and stay up to date on the latest articles your peers are reading.
You know about us, now we want to get to know you!
Let's personalize your content
Let's get even more personalized
We recognize your account from another site in our network, please click 'Send Email' below to continue with verifying your account and setting a password.


Let's personalize your content