This site uses cookies to improve your experience. To help us insure we adhere to various privacy regulations, please select your country/region of residence. If you do not select a country, we will assume you are from the United States. Select your Cookie Settings or view our Privacy Policy and Terms of Use.
Cookie Settings
Cookies and similar technologies are used on this website for proper function of the website, for tracking performance analytics and for marketing purposes. We and some of our third-party providers may use cookie data for various purposes. Please review the cookie settings below and choose your preference.
Used for the proper function of the website
Used for monitoring website traffic and interactions
Cookie Settings
Cookies and similar technologies are used on this website for proper function of the website, for tracking performance analytics and for marketing purposes. We and some of our third-party providers may use cookie data for various purposes. Please review the cookie settings below and choose your preference.
Strictly Necessary: Used for the proper function of the website
Performance/Analytics: Used for monitoring website traffic and interactions
To build an outside-in model, and use new forms of analytics, we must start the discussion with the question of, “what drives value?” ” Traditional planning modelsoptimize functional processes to improve cost and customer service. You are right. What should we do? What should be on the scorecard?
Optimizing fulfillment requires a series of steps to get a shipment from its source to the end customer. The formula for OTIF is: Measuring a supply chain against OTIF metrics is a key strategy that helps decision makers attach a tangible value to the success of their fulfillment and allows them to determine key strategies.
In follow-up qualitative interviews, one of the largest issues with organizational alignment was metric definition and a clear definition of supply chain excellence. In my post Mea Culpa, I reference my work with the Gartner Supply Chain Hierarchy of Metrics. Error is error, but is it the most important metric? My answer is no.
However, as carbon taxes and emissions reporting requirements continue increasing, supply chain professionals face mounting pressures from inside and outside their organizations to measure and improve performance against new, nebulous sustainability metrics. Sustainability is high on the list of favorite corporate buzzwords.
Transitioning to Renewable Energy The shift from fossil fuels to renewable energy is vital for mitigating the environmental impact of logistics. Key strategies include: Electrification of Transport: The use of electric vehicles (EVs) for freight and last-mile delivery reduces emissions and operational costs.
As supply chains become more interconnected and risks more dynamic, traditional procurement tools fall short. AI agents offer a smarter, faster way to manage sourcing, risk, and spend across the entire procurement lifecycle. What’s the technology behind autonomous procurement agents? You may also have heard of Agentic AI.
As supply chains become more interconnected and risks more dynamic, traditional procurement tools fall short. AI agents offer a smarter, faster way to manage sourcing, risk, and spend across the entire procurement lifecycle. What’s the technology behind autonomous procurement agents? You may also have heard of Agentic AI.
Procurement and supply chain management are often used interchangeably—but in practice, the lines between them can blur in ways that create real friction. Misaligned priorities, siloed systems, and unclear ownership can directly impact key performance indicators like cost savings percentage and procurement cycle time.
Most of the business networks were hollowed out by venture capitalists or purchased by opportunists. ” My problem is that we move through these hype cycles with little accountability for spending and with a major opportunity cost to not redefine work. How do I train and maintain the logic?”
In this type of environment, traditional procurement software and manual processes are insufficient – and many procurement teams are looking to artificial intelligence (AI) for answers. Key Takeaways Understand the potential impact of AI – including Generative AI & AI Agents – in procurement.
Enterprise procurement leaders are under more pressure than ever—juggling cost control, compliance, supplier risk, and internal complexity, all while trying to modernize outdated systems. AI, automation, and generative tools are redefining efficiency, allowing procurement teams to move from reactive to proactive decision-making.
Traditionally, procurement has been a process weighed down by manual tasks, fragmented systems, and endless paperwork. Today, procurement is undergoing a transformation. While procurement teams have long worked to add strategic value, Artificial Intelligence (AI) amplifies their impact.
This year’s conference brought together industry leaders, tech pioneers, and retail professionals to address challenges and opportunities, to explore technologies and strategies that promise to revolutionize the industry. Here are the key insights we gathered firsthand at this year’s event.
A disruption at any point in the global logistics network including the average of 12 touch points from shipment packaging to final delivery can prove disastrous for profits, service levels, customer loyalty, and other key metrics. With the global e-commerce market predicted to reach $8.1 billion to $23.07
Enterprise procurement teams face growing pressure to deliver strategic value – managing supplier risk, ensuring compliance, and supporting sustainability – all without sacrificing speed or control. This blog explores the most common challenges in digital procurement and the capabilities that matter most.
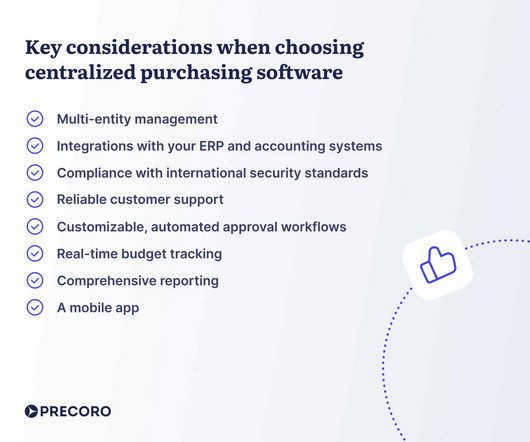
For most CPOs and CFOs, deciding on the right purchasing setup — centralized or decentralized — is no small task. Each model has its perks, and choosing the best fit can feel like walking a tightrope. Keep reading to learn: What is centralized purchasing? What is centralized purchasing?
Strategic sourcing and innovative solutions are often viewed as two distinct procurement tools, but they should not be seen in isolation. Think of them as apples and gearseach essential and effective on its own, yet when combined; they create a formidable mechanism for achieving procurement excellence.
Supply chain efficiency is the cornerstone of success and involves the effective management of processes, resources, and technologies from procurement to production, transportation to warehousing. As companies across industries have discovered, a well-optimized supply chain can drive significant improvements throughout their operations.
If you’re evaluating procurement technology or exploring ways to drive more value from existing systems, chances are you’re looking beyond tactical fixes – you want a smarter, scalable strategy. Misaligned priorities across finance, legal, and procurement create friction that delays decision-making and reduces impact.
But between rising costs, complex logistics, and the constant struggle to optimize space and labor, staying ahead can feel like an uphill battle. That’s where warehouse optimization comes in. Here’s what you can expect: A clear definition of warehouse optimization and its core components. Ready to get started?
It is crucial for organizations to understand the importance of Purchase Order collaboration to effectively manage their direct spend, optimize operations, and mitigate risks. Configure to Order: This strategy involves customizing standard products based on customer specifications.
Procurement and Supply Chain Management are essential functions that can help companies navigate these challenges, but they are often siloed and operate in separate departments. Their metrics are often misaligned as well – supply chain focuses on service and procurement focuses on the cost of acquiring materials and services.
Enhanced Promotions and Events Analysis Promotions, advertising campaigns, and trade events are vital components of marketing strategy, but accurately measuring their impact on demand remains challenging. Five Ways Advanced Machine Learning in Demand Planning Is Improving Forecasting 1.
Next Steps: Start to model demand based on market data to align the organization on baseline demand. Resist the temptation to place deeper analytics on top of existing data models. Instead, rethink the model and the approach. Out of desperation, they turned to the use of descriptive analytics. Next Steps.
At each company, there is a relationship between the metrics of growth, margin, inventory, customer service, and asset strategy. For the purpose of this article, I will use Return on Invested Capital (ROIC) as the proxy metric to discuss asset utilization.) Understanding this relationship requires modeling. (A
The trade with Asia we take for granted today was only possible by mitigating a significant supply chain trade-off – reducing costs without appreciable impacts to quality and service. Supply chain optimization has also improved in significant ways that can address these trade-offs better than before.
GEP and the North Carolina State University (NCSU) Supply Chain Resource Cooperative surveyed supply chain, procurement and IT professionals across a range of industries to gain insight into their priorities and strategies regarding supply chain resilience and optimization.
When reviewing strategy decks for supply chain teams, I often see statements like “move from a functional-silo’d focus to a drive a more holistic response.” ” Or “push a shift from a focus on cost to drive value?” Functional Metrics. ” Sound familiar? Organizational Alignment 2012.
Introduction Gardner, (1954) and Huntzinger, (2007) define Purchaseprice variance (PPV) as a metric used to measure the effectiveness of cost-saving efforts by calculating the difference between the planned cost (standard pricing) allocated for purchasing activities and the actual cost incurred.
Analytics and business intelligence (BI) are no longer optionaltheyre essential. They integrate, align, and activate data across the business to drive better, faster decisions unlike legacy reporting tools that can’t. Flexible Delivery Options Interactive dashboards, scheduled reports, alerts, mobile access, and more.
This shift has pushed supply chain leadership to pivot from reactive management to proactive strategy built on data. Analytics allows organizations to move beyond intuition. With real-time dashboards, predictivemodels, and risk simulations, leaders can identify bottlenecks before they occur.
The past few years have created a lasting impact on the way business is conducted, driving many companies to analytics to gain the visibility they need to control and optimize key processes. The Basics of Procurement KPIs. To accomplish this, our clients rely on the built-in data hub of our Stratum reporting application.
Looking to improve operations and achieve cost savings within your procurement processes? Perhaps you already have a process audit report, or are interested in discovering how it could benefit you and streamline your operations. What is the Purpose of a Process Audit Report?
As an old gal, with over forty-years of supply chain experience, writing this report for ten years taught me many lessons. I find in the orbit chart analysis that 45% of companies in the report are unconsciously incompetent. The group’s response is, “Are these supply chain metrics?” I admit it.
So, distribution center managers who leverage strategic slotting optimization technology could cut picking costs by up to 50 percent. However, the true benefits of slotting optimization technology go back to the development of strategic improvements in distribution centers in these key ways.
There is so much data, and to make use of it, we need to use data mining and analytics to drive meaningful insights that can be put to some good use. ABC analysis creates product segments by grouping products with similar sales volume or purchase frequency to enable category managers to focus on what matters most.
How aligned do you believe your organization is to drive these metrics? See the World Kitchen case study in the Agility Report. The work on the correlation of supply chain metrics to Market Capitalization demonstrates the importance of the management of margin (not costs) against inventory turns. Is your plan feasible?
It’s like having a magic wand that optimizes inventory levels, prevents shortages, and sharpens your demand forecasting—all from your smartphone. Mobile inventory management is a digital solution that combines a mobile inventory app with cloud-based software to track, manage, and optimize inventory in real-time.
This is why I host training twice a year to challenge existing technology paradigms. I see a preponderance of reports and white papers that have lots of pages but say little. Optimization engines to improve functional metric performance resulted in an exploding number of planners. The average purchased order changes 3.5
Striking the perfect balance between available stock and cost efficiency is key. By leveraging analytics and key performance indicators (KPIs), manufacturers can optimize inventory, reduce waste, and boost profitability. In this post, well dive into six critical KPIs that influence inventory optimization.
Understanding how your Procurement and Supply Chain KPIs are performing isn’t just a nice-to-have; it’s essential for survival and growth. Is inventory bloating your costs? Why You Need Visibility of Supply Chain and Procurement KPIs? Running procurement and supply chain without metrics is like driving blindfolded.
The consulting team pitches a theme–vision of supply chain best practices, big data analytics, or demand-driven value networks– to the executive team, and a new project is initiated. It was also the preference of the consulting partners because the projects were longer, more costly and better aligned with the consulting model.
In recent years, the overall state of Procurement has been bolstered by increased proficiency, expanding engagement, and a growing direct impact on operations. And they’re not the only ones—other department heads are also increasingly budget-conscious, creating a new opportunity to partner with procurement for better budget management.
Wikipedia In 2014, I was exploring methods to publish what is now the Supply Chains To Admire report. The use of orbit charts allowed me to see the patterns of performance at the intersection of metrics over time. We purchase data from Y charts. (A We have archived corporate reporting from Y charts for 1982-2023.
We organize all of the trending information in your field so you don't have to. Join 102,000+ users and stay up to date on the latest articles your peers are reading.
You know about us, now we want to get to know you!
Let's personalize your content
Let's get even more personalized
We recognize your account from another site in our network, please click 'Send Email' below to continue with verifying your account and setting a password.


Let's personalize your content