This site uses cookies to improve your experience. To help us insure we adhere to various privacy regulations, please select your country/region of residence. If you do not select a country, we will assume you are from the United States. Select your Cookie Settings or view our Privacy Policy and Terms of Use.
Cookie Settings
Cookies and similar technologies are used on this website for proper function of the website, for tracking performance analytics and for marketing purposes. We and some of our third-party providers may use cookie data for various purposes. Please review the cookie settings below and choose your preference.
Used for the proper function of the website
Used for monitoring website traffic and interactions
Cookie Settings
Cookies and similar technologies are used on this website for proper function of the website, for tracking performance analytics and for marketing purposes. We and some of our third-party providers may use cookie data for various purposes. Please review the cookie settings below and choose your preference.
Strictly Necessary: Used for the proper function of the website
Performance/Analytics: Used for monitoring website traffic and interactions
To improve,” the report rightly notes, “organizations should enhance supply chain visibility with robust data and analytics; use AI to foresee disruptions; keep business continuity plans current; and diversify supply sources, suppliers, manufacturing and logistics partners.” net promoter score or similar metric) as a supply chain KPI.
A lack of standardized ESG metrics across industries and regions makes it challenging to consistently evaluate and compare supplier performance. Many ESG claims are self-reported without third-party validation, raising questions about accuracy and reliability. Data collection and verification remain areas of concern.
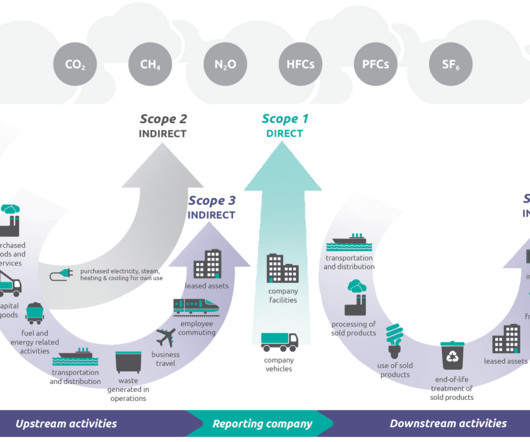
As regulations across the globe strengthen, the pressure to collect, report, and organize emission-related metrics has never been higher. Structure Your Data for Seamless Reporting Most reporting statutes already require or will require companies to provide data for their Scope 1 through 3 emissions.
Additionally, ensuring that current reporting mechanisms align with DPP requirements is vital for long-term compliance and operational success. Successful integration leads to improved transparency, streamlined reporting, and enhanced decision-making.
2022 was the year of corporate commitments to sustainability, and 2023 is the year where promises become proposals, mission statements become metrics, and aims become actions. Companies will have to report on sustainability in a similarly controlled way as they do their financials. We need to act now by making the right decisions.
Solvoyo has a metric they call the user acceptance rate. This metric measures the percentage of time the planners accept replenishment, transportation, or inventory plans as they are without any change in the timing of the delivery or the quantity to be delivered. We have lots of functions, lots of analytics, lots of reports.”
Samuel Parker and Joe Lynch discuss DAT iQ: the metrics that matter. Key Takeaways: DAT iQ: The Metrics that Matter In the podcast interview, Samuel Parker gave a freight market overview based on DAT’s database of $150 billion in annual market transactions.
Public Reporting: Publishing sustainability reports and ethical compliance metrics to highlight progress and areas of improvement. Key transparency initiatives include: Supply Chain Mapping: Using digital tools to trace the journey of products from raw materials to finished goods.
Leaders must track and report progress using established frameworks such as the Global Reporting Initiative (GRI) or the Science-Based Targets Initiative (SBTi). Measuring Progress and Building Trust Transparency is essential in sustainability efforts.
In a recent survey with Demand Gen Report, we found 59% of experienced practitioners (those with ABM programs more than a year old) indicated their ABM programs are meeting or greatly exceeding their expectations, while only 45% of novices (those with ABM programs less than one year old) could say the same.
Functional Metrics and the Lack of Alignment to Strategy. Few companies are clear on the number of supply chains they operate, design the rhythms and cycles of each, and align metrics to the strategy. These two reports are coming soon. The industry is not clear on desired outcomes. Clarity on Value. Guess what? It doesn’t.
Use of Supply Chain Descriptors Most organizations are locked into functional silos driven by functional metrics. Stuck in a rut, supply chain leaders try to punch their way through a set of conflicting metrics and priorities each day. The metrics defining success in manufacturing and procurement do not align.
The Losers Are the Global Multi-National Supply Chain Teams As I work on the Supply Chains to Admire report, that will publish soon, I wince at the performance of large strategic customers of the supply chain planning vendors when compared to their peer groups. Today, companies measure too many metrics without a clear definition of value.
Dell reports reduced cycle times and improved productivity as a result. Built-In Sustainability Reporting Some orchestration tools are adding carbon tracking or energy use metrics alongside cost and delivery performance data. This makes it possible to adjust schedules and workflows directly on the shop floor.
Just by embedding analytics, application owners can charge 24% more for their product. How much value could you add? This framework explains how application enhancements can extend your product offerings. Brought to you by Logi Analytics.
billion rate data points monthly to provide the most comprehensive view of the market, helping you identify savings opportunities and make data-driven decisions.
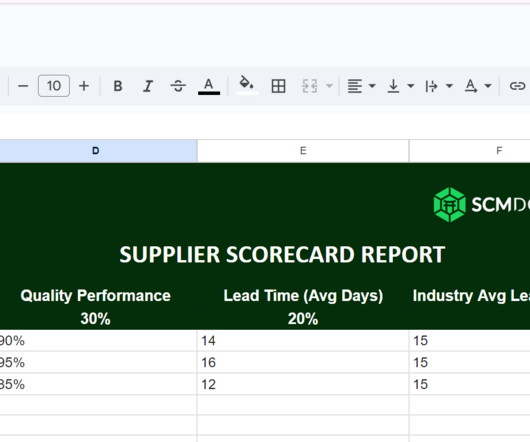
Supply chain reports offer a comprehensive view of your entire supply chain operation. What are Supply Chain Reports? Supplier Performance Evaluating supplier performance based on key metrics such as on-time delivery, quality of goods received, adherence to agreed-upon terms, and responsiveness to inquiries.
With freight transport accounting for a significant share of global emissions, efforts to improve logistics now extend beyond operational metrics to include resilience, regulatory compliance, and climate performance. A related challenge lies in emissions tracking and reporting.
They integrate, align, and activate data across the business to drive better, faster decisions unlike legacy reporting tools that can’t. The best systems feature these five components: A Unified Data Hub Centralizes and harmonizes data for one-number reporting and consistent insights.
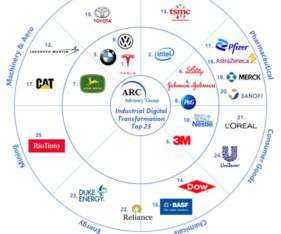
The report identified the leaders and highlighted best practices. This is the inaugural edition of the report. The report said of Tesla, “when Tesla sets out to automate its internal processes, they try to build it better from the start rather than start a clunky project and hope to get better on revision 4 or 5.
We consistently see that companies focused on functional excellence–a focus within a functional silo like manufacturing, transportation or distribution– or singular metrics– like inventory or costs– underperform against their peer groups. Reward teams for cross-functional metrics. Cost-to-Serve Analysis.
In addition, the employees in this role, report the highest job dissatisfaction of anyone in supply chain. Form and socialize your own hierarchy of metrics. Here is the metrics framework that I am using at present in my outside-in classes. I work with a company that had 210 planners in 2005 and now has 1475 global planners.
Using balance sheet data from 2011 to 2019, we chart companies’ progress by peer group on rate of improvement and performance in the metrics of growth, operating margin, inventory turns, and Return on Invested Capital (ROIC). This week, while all my friends are on vacation, I am writing the final report for the Supply Chains to Admire.
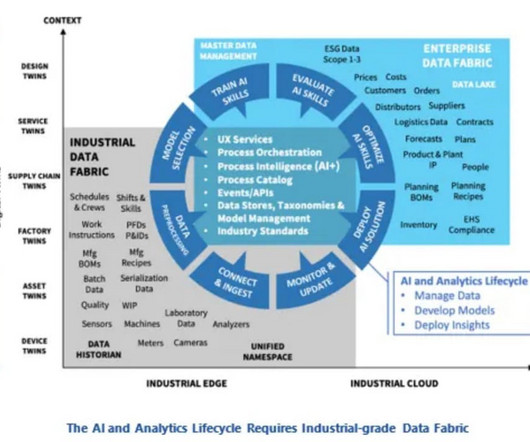
Mr. Masson recently wrote the report “ Industrial-grade AI: Transforming Data into Insights and Outcomes.” Not all the transactional data, just the data required to calculate a metric or make a decision. Mr. Masson leads ARC’s research on industrial AI and data fabrics. So, we deploy an agent on an SAP environment.
Early adopters of these integrated platforms report significant improvements in inventory turnover and reduction in stockouts. Leading retailers implementing these advanced systems report notable improvements in forecast accuracy, particularly in volatile market conditions.
A shift from functional metrics to a balanced scorecard. I like the use of growth, margin, inventory turns, Return on Invested Capital, customer service and ESG metrics. The focus on functional metrics sub-optimizes balance sheet results. Reports to a Profit Center Manager. Funny, isn’t it?
A disruption at any point in the global logistics network including the average of 12 touch points from shipment packaging to final delivery can prove disastrous for profits, service levels, customer loyalty, and other key metrics. With the global e-commerce market predicted to reach $8.1
At each company, there is a relationship between the metrics of growth, margin, inventory, customer service, and asset strategy. For the purpose of this article, I will use Return on Invested Capital (ROIC) as the proxy metric to discuss asset utilization.) I never calculated and accounted for the inter-dependencies between metrics.
As an old gal, with over forty-years of supply chain experience, writing this report for ten years taught me many lessons. I find in the orbit chart analysis that 45% of companies in the report are unconsciously incompetent. The group’s response is, “Are these supply chain metrics?” I admit it.
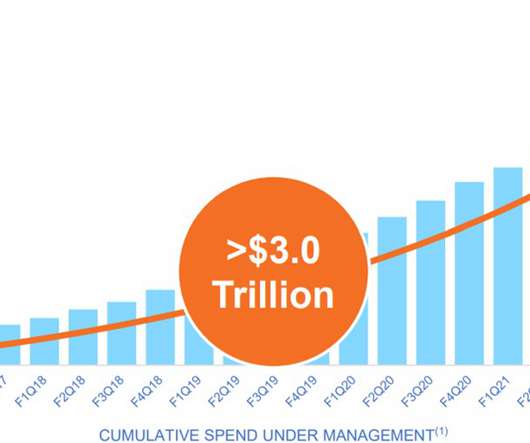
In 2021, Coupa reported losses of $180.1 The Rule of 40 was popularized by venture capitalists in recent years as a key performance metric for SaaS firms. The metric captures the trade-off between short-term viability and the investment in growth. They report that Coupa is at 58.2% on this metric. trillion.
billion rate data points monthly to provide the most comprehensive view of the market, helping you identify savings opportunities and make data-driven decisions.
The time gave me a good time to reflect and finish the reports that I should have completed in the summer when I recovered from Uterine Cancer. Writing and Reflection Completing the edits on the two reports that are publishing soon, felt good. The reports took me two months to write. Today, I wish good health for each of you.
Wikipedia In 2014, I was exploring methods to publish what is now the Supply Chains To Admire report. The use of orbit charts allowed me to see the patterns of performance at the intersection of metrics over time. We have archived corporate reporting from Y charts for 1982-2023. We purchase data from Y charts. (A
This report takes me about six weeks to complete.). One of my stark realizations this year is that smaller companies are beating larger and often more established companies on growth metrics, inventory turns, operating margin, and Return on Invested Capital (ROIC). (In In the report, we study twenty-eight sectors.
Despite goals to improve agility and resiliency, functional metrics for manufacturing efficiency continually throw the supply chain out of balance. I am currently writing the Supply Chains to Admire report for 2020. The second step is to align metrics to the strategy. Efficient supply chains may not be the most effective.
We’ll examine the key components of efficient supply chains, explore essential performance metrics, and uncover the fundamental drivers that influence efficiency. Efficient supply chains strengthen collaborative relationships through automated communication systems and shared performance metrics.
How are companies rethinking their liquidity management strategies in response to the recent degradation across major working capital metrics? In the wake of economic uncertainty, many companies have experienced a degradation in key working capital metrics.
How aligned do you believe your organization is to drive these metrics? See the World Kitchen case study in the Agility Report. The work on the correlation of supply chain metrics to Market Capitalization demonstrates the importance of the management of margin (not costs) against inventory turns. Is your plan feasible?
Fondly I remember the days of Walter Cronkite and Dan Rather with eye-witness accounts and on-the-ground reporting. For the past six years, I have analyzed public reporting and triangulated the results to the quantitative research. We selected these metrics based on correlation work with Arizona State University in 2012.
These include: Challenges getting ESG metrics from suppliers, partners, and other third parties. Time-consuming manual processes to report on ESG metrics. The World Economic Forum reports that, “by 2025, technology will create at least 12 million more jobs than it destroys.” Start with your supply chain.
Perhaps you already have a process audit report, or are interested in discovering how it could benefit you and streamline your operations. Either way, heres some insight into how you can use a process audit report to your advantage, including a complementary process audit report template for you to get started within minutes.
Background In a prior Supply Chain Matters commentary , we provided highlights and observations related to February 2025 production and supply chain activity levels as provided by various global wide and regional PMI index reporting. The reported overall value of 62.8 The reported overall value of 62.8 respectively.
Finally, establish standardized data collection procedures across all relevant departments, ensuring consistent measurement and reporting. Data analytics helps you monitor key performance indicators (KPIs), like supplier performance, delivery times, and transportation efficiency — all in real-time.
For instance, according to a recent report from Energy and Climate Intelligence Unit, 21% of the world’s largest organizations, representing $14 trillion in revenue, have made commitments to achieve net-zero emissions. [1]. Data accuracy to aid in decision-making — One must have a system to draw insight from data.
We organize all of the trending information in your field so you don't have to. Join 102,000+ users and stay up to date on the latest articles your peers are reading.
You know about us, now we want to get to know you!
Let's personalize your content
Let's get even more personalized
We recognize your account from another site in our network, please click 'Send Email' below to continue with verifying your account and setting a password.


Let's personalize your content