This site uses cookies to improve your experience. To help us insure we adhere to various privacy regulations, please select your country/region of residence. If you do not select a country, we will assume you are from the United States. Select your Cookie Settings or view our Privacy Policy and Terms of Use.
Cookie Settings
Cookies and similar technologies are used on this website for proper function of the website, for tracking performance analytics and for marketing purposes. We and some of our third-party providers may use cookie data for various purposes. Please review the cookie settings below and choose your preference.
Used for the proper function of the website
Used for monitoring website traffic and interactions
Cookie Settings
Cookies and similar technologies are used on this website for proper function of the website, for tracking performance analytics and for marketing purposes. We and some of our third-party providers may use cookie data for various purposes. Please review the cookie settings below and choose your preference.
Strictly Necessary: Used for the proper function of the website
Performance/Analytics: Used for monitoring website traffic and interactions
The research methodology for the Supply Chains to Admire compares the performance of a company against its industry peer group for the metrics of Year-over-Year Revenue Growth, Inventory Turns, Operating Margin, and Return on Capital Employed (ROCE). For 80% of industries, the supply chain metrics represent more than 40% impact on value.
At each company, there is a relationship between the metrics of growth, margin, inventory, customer service, and asset strategy. For the purpose of this article, I will use Return on Invested Capital (ROIC) as the proxy metric to discuss asset utilization.) I never calculated and accounted for the inter-dependencies between metrics.
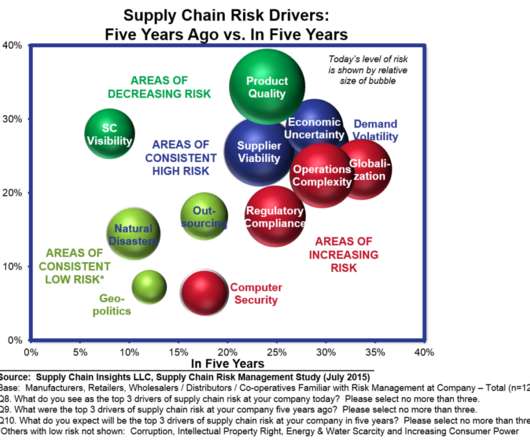
Most supply chain leaders cannot get their groove on because they generalize–the use of the same metric targets and tactics for the supply chain without paying attention to the flows. In Figure 1, I share data from the risk management study of 2015. The Role of Demand Variability in Risk Mitigation from the 2015 Study.
As we head into 2016, we are featuring our most read articles of 2015 in our five main categories: Manufacturing, Supply Chain, Logistics, Transportation Management, and Freight. Yesterday we published the top 10 most read manufacturing articles of 2015. . Top 10 Supply Chain Articles from 2015. Read the full article here. .
In my work tonight, I carefully studied 2006-2015 financial results to select the Supply Chains to Admire winners. The winners drive improvement while posting financial results in the Supply Chain Metrics That Matter ahead of the peer group. Higher percentage of growth than the industry average for the period of 2006-2015.
To help, in this post, we provide you with some insights for the period of 2006-2015. The supply chain is a complex system with finite, and non-linear relationships between supply chain metrics that drive balance sheet results. We find that companies can improve one, but not two of the metrics. A Look at History. Resiliency.
I would like for us to move past the conventional view of sourcing strategies and globalization to drive improvements to the supply chain in a variable world. The populist narrative of sourcing globalization is only part of the story. In 2015, the forecastable volumes were over 50%. Let me explain. Forecastability.
Over the period of 2009-2015 only 88% of companies made improvement on the “Supply Chain Metrics That Matter.” (The The Supply Chain Metrics That Matter are a portfolio of metrics which correlate to higher market capitalization. Comparison of Performance and Improvement of Companies in the Chemical Industry for 2009-2015.
Decarbonization around the world A key milestone in the global decarbonization effort was the 2015 Paris Agreement , which aims to limit the increase in global average temperature “to well below 2°C above pre-industrial levels”, while pursuing efforts to “limit the temperature increase to 1.5°C C above pre-industrial levels.”
Completed in 2012, the ERP project forced the company to standardize organizational design, roles, and metrics. They saw a steady drop in inventory and reduced working capital by about 50% over the period of 2011-2015. Shell operates as a single-instance of SAP Enterprise Resource Planning (ERP). The reason? Talking numbers worked.
The company said that it used 85,916 metric tons of single-use plastic that year, an 11.6 Walmart announced that it will pilot agriculture technology with crop supply intelligence company Agritaskto get real-time information on crops and improve sourcing decisions around produce. billion in 2015. percent decrease from 2021.
Most companies segment their supply chain by breaking it down according to operational and logistical metrics. In a 2015 SupplyChainBrain interview she says this allows companies to give their customers a differentiated experience – she compares it to the difference between fine dining and fast food.
For the past five years, the team at Supply Chain Insights identified Supply Chains to Admire Award Winners by analyzing performance by peer group on the key metrics of growth, operating margin, inventory turns and Return on Invested Capital (ROIC). However, localized sourcing shortened leadtimes and improve responsiveness.
For the past five years, the team at Supply Chain Insights identified Supply Chains to Admire Award Winners by analyzing performance by peer group on the key metrics of growth, operating margin, inventory turns and Return on Invested Capital (ROIC). However, localized sourcing shortened leadtimes and improve responsiveness.
The company leverages globally sourcing strategies to buy products at a lower cost and then deploys some unique process logic to drive mass customization for retailers. Over the period of 2009-2015, only 88% of companies made improvement on the Supply Chain Metrics That Matter. (As About the Supply Chains to Admire Research.
The field of supply chain management–combining source, make and deliver–into a common process started in 1982. Figure 1: Supply Chain Metrics Are a Balancing Act. The metrics shown in Figure 1 are difficult to improve together. Most companies improve singular metrics but are not able to drive portfolio.
In 2015, I worked with a manufacturer of men’s underwear. (My These included cloud-based computing, in-memory processing, parallel computation, and open-source analytics. Open Source Analytics: A set of languages, techniques and tactics to enable parallel processing, schema on read, and data insights. Open Source analytics.
It is data driven research: a deep analysis of performance, improvement and Price to Tangible Book Value of 320 companies across 31 industries for the period of 2009-2015. The source data for the analysis is public reporting of balance sheets and income statements. The Supply Chains to Admire analysis is now in its third year.
For instance, when a disaster such as a hurricane, a labor strike, or a bankruptcy disables key suppliers, quick-moving enterprises are able to lock in alternative sources of supply before their rivals. There is growing interest in incorporating weather forecast data from a variety of sources into supply chain planning.
CEVA Logistics is taking a lead in the air cargo industry to reduce the logistics-related impact on the environment at the source by creating demand for more sustainable aviation fuel (SAF). This program is the first of its kind involving global corporations working with the airline to power future flying in a more sustainable way.
The network senses, translates, and orchestrates market changes (buy- and sell-side markets) bidirectionally with near real-time data to align sell, deliver, make and sourcing organizations outside-in. An example of social listening is the Lenovo Case Study presented at the 2015 Supply Chain Insights Global Summit. Market Drivers.
In most ‘benchmarking activities’, self-reported data is the most common source. It is for this reason, that we asked companies participating in our 2015 Supply Chain Planning Benchmarking to share raw data. Debra built the Gartner Hierarchy of supply chain metrics. Self-reporting of data does not meet this standard.
We then rated companies on their ability to manage and improve a portfolio of metrics: operating margin, inventory turns and Return on Invested Capital (ROIC). 2015 Supply Chains to Admire. We are targeting much improved end-to-end planning in response to multiple demand sources. and Singapore. We are on the journey.
Structured and unstructured data including that from social media, Internet of Things (IoT) and Blockchain sources continue to stream in but much is left untouched. Key Performance Metrics: The ability to identify and measure KPIs will help prioritize and measure transformation efforts. www.forbes.com , 2015. References.
Over the period of 2009-2015, only 88% of companies made improvement on the Supply Chain Metrics That Matter. Companies passing these two tests are then analyzed against the performance factors for 2009-2015: Growth. Orbit Chart of VTech for the Period of 2006-2015 at the Intersection of Operating Margin and Inventory Turns .
After, I explained this, I granted Peter permission for the council to use the Index (the use of the Supply Chain Insights content follows the principles of open source), I then said to Peter, “I am glad that you called. On March 16th-18th, I will be on a book tour in Europe discussing the concepts of Supply Chain Metrics that Matter.
In 2015 Insight acquired E2open, and Infor acquired GT Nexus. After a very tough decade, the Supply Chain Operating Network solutions were evolving with strong development plans during the period of 2012-2015. . Normally the only winner in a technology acquisition is the original venture capitalists of the company being acquired.
You can use network design models, company KPIs and other metrics to get a holistic look at your supply chain. This provides high-level metrics for evaluating risk in the supply chain. Source: Business Continuity Institute Supply Chain Resilience Report 2015. He holds a BS in Engineering from the Colorado School of Mines.
It is data driven research: a deep analysis of performance, improvement and Price to Tangible Book Value of 320 companies across 31 industries for the period of 2009-2015. The source data for the analysis is public reporting of balance sheets and income statements. The Supply Chains to Admire analysis is now in its third year.
Source: Dictionary.com. My journey to understand SanDisk started in June 2015. Founded in 1988 in Milpitas, California, SanDisk is publicly traded on NASDAQ with 8,600 employees globally, and market capitalization in 2015 over $13B. I had the opportunity to visit with the SanDisk team in July 2015. in Net Cash on Hand.
Source: Google. This was not a trivial transition because the software industry, until relatively recently, was long fixated on measuring its health and success by new license revenue (sales of products) instead of customer-centric metrics, such as realization of ROI and payback objectives. Where is Descartes today?
The network senses, translates, and orchestrates market changes (buy and sell-side markets) bi-directionally with near-real time data to align sell, deliver, make and sourcing organizations outside-in. E2open, following a rough 2014, was purchased by Insight Venture Partners in 2015. Thoma Bravo purchased Elemica in June 2016.
Supply chain network and transportation optimization can help make better sourcing and multi-stop route decisions that ultimately result in route design that balances low costs with higher service. In 2010, Walmart announced its goal to eliminate 20 million metric tons of GHG emissions from its global supply chain by the end of 2015.
The source of the content is research. Last night, as I was working on the report for the newsletter, I wrote a summary of the last study which we completed in 2015 on the adoption of technology. I manage a team at Supply Chain Insights and actively publish using an Open Content research model. Overview of Supply Chain Insights.
In the last decade, many companies, especially those with manufacturing operations, have evolved direct materials sourcing from an administrative function to a strategic procurement process. Adopt performance metrics for carriers. Meanwhile, ocean carriers continue to deal with overcapacity; rates for Asia-U.S.
Used as a one-to-many data model for sourcing and procurement by companies like IBM, Cisco Systems, Dell, Motorola, Seagate, and Vodafone , there is much promise; but in the last five years the Company, plagued by execution issues, encountered problems. There is greater dependency on third parties for manufacturing and sourcing.
Source: “Tech in Asia” – https://www.techinasia.com. You have to think and act beyond cost manage and find ways to leverage supply chain and logistics as a competitive weapon — that is, look for ways to leverage supply chain management to drive top-line growth, increase market share, and enhance customer loyalty.
A traditional approach to sourcing—looking at potential suppliers through familiar lenses such as price, quality, and reliability—had the benefit of straightforward metrics on which to base a comparison. How should these be balanced against traditional procurement metrics? Choices, choices, choices. On what measure?
Source: Machine Learning – A Giant Leap for Supply Chain Forecasting, Material Handling and Logistics Conference (PDF, 28 pp., Source: Machine Learning & AI in Transport and Logistics, Frank Salliau & Sven Verstrepen Logistics Meets Innovation Vlerick Brussels – Nov. no opt-in). 15th, 2017 (PDF., no opt-in). no opt-in).
” CNN Money Watch, August 12, 2015. There is more in-transit inventory–sitting on the water in larger ships, in-transit through international sourcing strategies, or work with contract manufacturers–as a result, to avoid inventory write-offs, the foot needs to hit the brake faster. The water cooler is buzzing.
Hadoop is an open-source software framework written in Java for distributed storage and processing of large data sets on computer clusters. I recently visited a large beverage company that has three point of sale systems, four customer insights databases, and numerous retailer information sources. The data is not moved. (In
Top 10 Supply Chain Innovations of 2015 : solar-powered vessel, robot dispatcher, 3-D printed flight parts, and more. The retail giant plans to take out 50 million metric tons (MMT) by 2030, which is equivalent to the emissions associated with the average annual electricity consumption of 40 million Chinese households. Media Type.
Potential Sources of Disruption. Identifying sources of risk and developing a plan are only part of the story. Establish appropriate metrics that correspond with the steps outlined in your contingency plan. What alternative plants/factories/sources of supply do they have at their disposal? Cyberattack and data breach.
For December 2015, retail sales were the lowest since 2009. As a result, the architecture for the EACH and chain of custody of products for eCommerce requires HADOOP and non-relational open source technologies like Apache Spark. Last week, Wal-Mart announced the closing of 269 stores and the layoffs of 10,000 employees.
We organize all of the trending information in your field so you don't have to. Join 102,000+ users and stay up to date on the latest articles your peers are reading.
You know about us, now we want to get to know you!
Let's personalize your content
Let's get even more personalized
We recognize your account from another site in our network, please click 'Send Email' below to continue with verifying your account and setting a password.


Let's personalize your content