This site uses cookies to improve your experience. To help us insure we adhere to various privacy regulations, please select your country/region of residence. If you do not select a country, we will assume you are from the United States. Select your Cookie Settings or view our Privacy Policy and Terms of Use.
Cookie Settings
Cookies and similar technologies are used on this website for proper function of the website, for tracking performance analytics and for marketing purposes. We and some of our third-party providers may use cookie data for various purposes. Please review the cookie settings below and choose your preference.
Used for the proper function of the website
Used for monitoring website traffic and interactions
Cookie Settings
Cookies and similar technologies are used on this website for proper function of the website, for tracking performance analytics and for marketing purposes. We and some of our third-party providers may use cookie data for various purposes. Please review the cookie settings below and choose your preference.
Strictly Necessary: Used for the proper function of the website
Performance/Analytics: Used for monitoring website traffic and interactions
CaseStudies. A CaseStudy. This casestudy will show you the analysis of Apple Supply Chain core processes, challenging issues and complexities of its operations. Information about Apple Supply Chain is a bit here, there and everywhere, its kinda tough to find the actual casestudy.
Analysis of casestudy is certainly one of the most popular methods for people from business management background. In order to accelerate the learning, this article has gathered 20+ most sought-after supply chain casestudies, analyzed/categorized them by industry and the findings are presented.
For the past five years, the team at Supply Chain Insights identified Supply Chains to Admire Award Winners by analyzing performance by peer group on the key metrics of growth, operating margin, inventory turns and Return on Invested Capital (ROIC). However, localized sourcing shortened leadtimes and improve responsiveness.
We consistently see that companies focused on functional excellence–a focus within a functional silo like manufacturing, transportation or distribution– or singular metrics– like inventory or costs– underperform against their peer groups. Reward teams for cross-functional metrics. Customer-Centric Supply Chain.
Just by embedding analytics, application owners can charge 24% more for their product. How much value could you add? This framework explains how application enhancements can extend your product offerings. Brought to you by Logi Analytics.
At a high level, procurement focuses on sourcing the goods and services an organization needs, while supply chain management oversees the broader flow of those goods, from raw materials to end customers. Supply Chain Management (SCM) involves orchestrating a product’s or service’s entire lifecycle, from sourcing and production to delivery.
At each company, there is a relationship between the metrics of growth, margin, inventory, customer service, and asset strategy. For the purpose of this article, I will use Return on Invested Capital (ROIC) as the proxy metric to discuss asset utilization.) A CaseStudy. A case is not a case. My learning?
Despite goals to improve agility and resiliency, functional metrics for manufacturing efficiency continually throw the supply chain out of balance. Most supply chain leaders speak out of both sides of their mouths… In my casestudy, Ed’s approach was brilliant, but the organization did not value agility. (I
History will also include casestudies of mergers and acquisitions. The study of improvement and performance for the 535 companies in 26 industries took two months. The source data for the analysis comes from Ycharts.). We selected these metrics based on correlation work with Arizona State University in 2012.
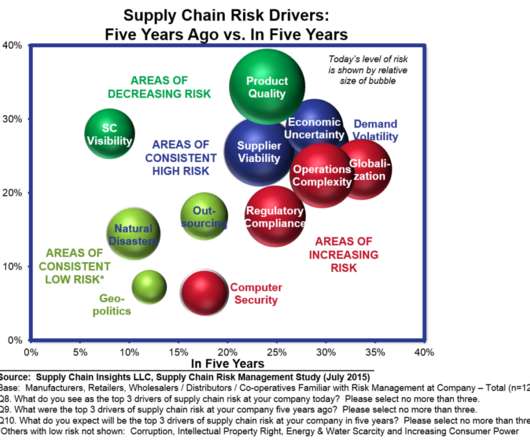
Most supply chain leaders cannot get their groove on because they generalize–the use of the same metric targets and tactics for the supply chain without paying attention to the flows. The Role of Demand Variability in Risk Mitigation from the 2015 Study. Wrong Metrics. A Client CaseStudy. ” Figure 2.
This guide breaks down the key procurement technologies in use today and the trends reshaping the future, such as AI-driven sourcing, predictive risk management, and deeper integration across the supply chain. What Is Procurement Technology? Here are some of the most important tools teams are already using.
Digital procurement streamlines workflows and unifies data, enabling faster sourcing, better collaboration, and improved accuracy. Digital procurement is the use of digital technologies to enhance, automate, and optimize procurement processes across the entire source-to-pay (S2P) lifecycle.
The most common use case for control towers is visibility. While there are many types of visibility (see Figure 1), the most common use case is either sourcing or transportation visibility. In the visibility use case avoid three watch outs: 1) Make Sure That The Data Is Actionable. Figure 4 is a casestudy from Lenovo.
In manufacturing-based companies, 70-80% of costs are in the processes of source, make and deliver. While the practices of finance are over 200 years old, in contrast, supply chain as a cross-functional practice (the combination of make, source and deliver) was recently defined in 1982. Is talent a cost or an asset?
CaseStudies. Cisco System CaseStudy. The only solid casestudy about supply chain risk is definitely from Cisco System. However, the logic Cisco uses to manage the disruption is very robust and details are summarized into the infographic below, Note: metrics data is for illustrative purpose.
Then, blogging and web contents have become the primary source of business ideas for many working professionals. Types of contents are ranging from opinion pieces, news, tips, casestudies, graphic contents and guides. Blogging also allows both business people and educators to reflect and stimulate opinions.
CaseStudies. Would you like to understand supply chain management concept but dont have time to study from a supply chain textbook ? Each customer in US or EU might already control the source of raw materials, ask you to provide dedicated production lines, nominate 3pl companies and air/sea carriers. A CaseStudy.
Conversely, a student who quickly grasps procurement strategies can be challenged with advanced casestudies and leadership projects. For instance, a student interested in sustainable supply chain practices might choose courses focused on green logistics, ethical sourcing, and environmental impact assessment.
CaseStudy Agility: ZARA. CaseStudy Resilience: CISCO. CaseStudy Risk management: The All England Club. Diversify supplier base : Supply chain should not be overly dependent on long lead-time or on a small pool of specific suppliers or sourcing regions. CONCLUSION.
As a result, companies are writing new casestudies through their actions or inaction. Make, source, and deliver need to be managed together based on analytics that sense and respond at the speed of business. Companies driven by functional metrics struggled: they could not adapt quickly to the higher transportation costs.).
For this casestudy we interviewed Ralf Busche, Senior Vice President of Global Supply Chain Strategy and Performance. Our goal in writing these casestudies is to share insights from the Supply Chains to Admire winners from 2016. The work of the BASF leadership team is a success story in managing global complexity.
The next posts in the series will break down metrics and issues to consider in SQM by industry and conclude with a casestudy on the application of SQM. 5 Key Metrics to Use for Scoring Supplier Quality Management (From LNS Research ). The definition of this metric is similar to the way it sounds. Cost of quality.
Digital commerce efficiently requires the digitalization of many customer-facing operations and sourcing and procurement. Supply chain planning involves interaction with different types of information based on internal and external data sources. These data sources are often spread across multiple platforms and come in various formats.
The network senses, translates, and orchestrates market changes (buy- and sell-side markets) bidirectionally with near real-time data to align sell, deliver, make and sourcing organizations outside-in. An example of social listening is the Lenovo CaseStudy presented at the 2015 Supply Chain Insights Global Summit.
I have learned that supply chain systems are more complex than I originally thought, and that the relationships between supply chain metrics are nonlinear. These tools allow us to look at sell, source, make, and deliver together. Along the way, I will be doing more work on network design casestudies.
An impressive casestudy to be sure, but alas, the cost of the technology is still prohibitive for most companies. Capturing it, cleaning it, screening it and analyzing it to determine better routes, better prices, and better sources is foundational to smart logistics operations. In a word, it’s data. Keep Your Eyes on the Road.
Completed in 2012, the ERP project forced the company to standardize organizational design, roles, and metrics. Nick formed a tight-knit implementation group with business users, and technologists used the backbone of SAP ERP to source master data and transactional flows from SAP and into Orchestr8. The reason? Talking numbers worked.
CaseStudy #1: Noble Biomaterials. Today, it has grown into a multinational sole-source technology supplier of medical components and antimicrobial products to the US military and various healthcare organizations. They wanted real-time data, visuals, and metrics for all manufacturing operations and business processes.
Therefore, the challenge to establish ranking method is to find more economical data source and unbiased metric. In supply chain management area, most industry publications create the ranking based on the input from readers then editorial team makes a final decision which is a bit subjective.
Year after year, well intentioned people toiled against improving metrics that reduced, not improved, the effectiveness of the supply chain. Metrics comparison of Kellogg Co. A CaseStudy. In part one of this blog series, I started the saga of the supply chain fairy tale. You got it! vs. General Mills, Inc.
I think about this discussion with Keith often as I work on the Supply Chain Index and edit the chapters of Metrics That Matter. This is the clear articulation of when and how to make, source, and deliver for the community. It is one thing to write it, but it is a horse of another color to defend it. We hope to see you there!
For the past five years, the team at Supply Chain Insights identified Supply Chains to Admire Award Winners by analyzing performance by peer group on the key metrics of growth, operating margin, inventory turns and Return on Invested Capital (ROIC). However, localized sourcing shortened leadtimes and improve responsiveness.
The selection of metrics is based on prior work with Arizona State University to understand which metrics, in combination, correlate to market capitalization and price to book value. Consider the casestudy of Sleep Number that outperforms in the furniture sector. Why do we spend four months doing this? Build Teams.
Key elements to include: Sustainability Goals and Metrics: Define clear sustainability goals aligned with the company’s overall objectives. Introduce relevant metrics for measuring environmental impact like carbon emissions, water usage, and waste generation.
The Cost Performance Index (CPI) is a financial efficiency metric used to measure cost performance in projects and operational activities. indicates cost inefficiency, signaling a need for supplier negotiations or alternative sourcing strategies. In this case the CPI would indicate cost efficiency. A CPI of 0.83
The source data for the analysis is public reporting of balance sheets and income statements. Check out their performance by plotting year-over-year metrics at the intersection of two ratios and look at the patterns. In the analysis of the Supply Chains to Admire, we use PTBV as a proxy metric of value.
No metric should be measured in isolation, and functional metrics should be replaced with the balanced scorecard metrics shown in Figure 2. To maximize value—price to tangible book, functional metrics need to be reset to focus on reliability. 5 A Focus on Functional Metrics Throws the Supply Chain Out of Balance.
Over the course of the last decade, companies have moved at different rates to align source, make and deliver processes to report to common leader. Based on our research at Supply Chain Insights , today, 34% of supply chain organizations have source, make and deliver reporting through a common organization.
The company leverages globally sourcing strategies to buy products at a lower cost and then deploys some unique process logic to drive mass customization for retailers. For this casestudy we interviewed Peter Smith, currently the EVP of Supply Chain for Carter’s. Performance on the Supply Chain Metrics That Matter.
Categories for the Pro-to-Know recognition include but are not limited to Supplier Management, Sourcing, Contract Management, eProcurement, Form Requests, and AP Automation. Metrics may include cycle times for each process, use of templates, user and supplier adoption, as well as process and cost savings.
Cloud and open source analytics are fueling new markets giving rise of new software providers in analytics with names like Board, Cloudera, EveryAngle, Enterra Solutions, FusionOps, Halo, Qlik, Spotfire, Transvoyant, Trifecta, and Trufa. There is a great need for improved supply chain analytics. New solutions offer great promise.
The orchestration of demand to supply evaluates the price elasticity of market pricing against the commodity risk in sourcing and the reliability of processes to deliver. Alignment of Functional to Corporate Metrics. I cannot wait to write your casestudy. Let me give you an example. Sincerely yours, The Shaman.
Diagnose Quality Defects Per Shift One of the most compelling insights came from analyzing shift-level performance metrics. Why This CaseStudy Matters to You? Supply chain decision intelligence & analytics platform detected that: Shift 3 produced 3x more defects than the other two shifts combined.
” At the other end of the continuum is the argument that “ Forecast error is the most important metric to improve.” Use The tactical planning horizon to make asset decisions, determine the best network design, design form and function of inventory, and establish sourcing strategies. ” I am in the middle.
We organize all of the trending information in your field so you don't have to. Join 102,000+ users and stay up to date on the latest articles your peers are reading.
You know about us, now we want to get to know you!
Let's personalize your content
Let's get even more personalized
We recognize your account from another site in our network, please click 'Send Email' below to continue with verifying your account and setting a password.


Let's personalize your content