This site uses cookies to improve your experience. To help us insure we adhere to various privacy regulations, please select your country/region of residence. If you do not select a country, we will assume you are from the United States. Select your Cookie Settings or view our Privacy Policy and Terms of Use.
Cookie Settings
Cookies and similar technologies are used on this website for proper function of the website, for tracking performance analytics and for marketing purposes. We and some of our third-party providers may use cookie data for various purposes. Please review the cookie settings below and choose your preference.
Used for the proper function of the website
Used for monitoring website traffic and interactions
Cookie Settings
Cookies and similar technologies are used on this website for proper function of the website, for tracking performance analytics and for marketing purposes. We and some of our third-party providers may use cookie data for various purposes. Please review the cookie settings below and choose your preference.
Strictly Necessary: Used for the proper function of the website
Performance/Analytics: Used for monitoring website traffic and interactions
Yawn and walk on if the answer is i mproving demand error or reducing inventory levels. On December 5th, Supply Chain Insights is hosting a small event at Georgia Tech to share the results of a two-year research effort to connect financial metrics by industry to supply chain performance to drive value.
A shift from functional metrics to a balanced scorecard. I like the use of growth, margin, inventory turns, Return on Invested Capital, customer service and ESG metrics. The focus on functional metrics sub-optimizes balance sheet results. Funny, isn’t it? Improved Forecast Value Added (FVA).
An average margin of 21% with inventory turns of 1.58 However, the key part of this comparison is the fact that Sanofi never drove improvement. As shown in Figure B, the company improved cash-to-cash through the extension of payables, but never improved inventory levels after the spin-off from Kraft.
It is now our fifth year of analyzing balance sheets to understand which companies are outperforming their peer groups on the metrics of growth, operating margin, inventory turns and Return on Invested Capital (ROIC) while driving improvement. In Table 3, I share a comparison of the two methodologies. This work is not easy.
Only four percent of companies compared to their peer groups improved balance sheet performance of growth, operating margin, and inventory turns. When compared to pre-recession years, we ended the decade with twenty more days of inventory. Days of InventoryComparison. Now, let’s take consumer products.
They had to be publicly traded, we had to have a nearly complete data set for the years studied, and they had to have a peer group of at least six companies to be able to draw the comparisons. However, due to a variety of factors, companies are losing ground on driving progress on both inventory turns and operating margin.
We talk about the move from functional metrics to a balanced scorecard, but we don’t use a balanced scorecard as an objective function. Orbit charts of four companies for the period of 2013-2022 at the intersection of operating margin and inventory turns. We talk about complexity, but do not measure the impact on forecastability.
Meaningless Comparison. I just don’t think the comparison of very different industries in a spreadsheet based on growth, inventory values, and Return on Assets (ROA) is meaningful. As a result, the metrics have to be viewed together as a pattern over time. I find value in looking at these metrics together.
Transportation metrics saw little change in May as capacity, utilization and pricing remained in expansion territory, according to a monthly survey of supply chain professionals. Spot rates remain slightly higher on a y/y comparison. Inventory costs (78.4) percentage points even as growth in inventory levels (51.5)
by Andrew Dunbar Over the last several weeks, this blog series on Inventory Management has explored the objectives and roles of inventory managers and outlined several of the improvement levers available to them. The metrics you choose should answer the questions your organization is asking, without requiring additional analysis.
The future inventory fire sale. One of my stark realizations this year is that smaller companies are beating larger and often more established companies on growth metrics, inventory turns, operating margin, and Return on Invested Capital (ROIC). (In The metrics selection resulted from work with Arizona State University in 2013.)
Based on the work with Georgia Tech, we are getting clear on which metrics matter by industry. As companies adopt a balanced scorecard, the functional metrics shift to a focus on reliability. The implementation of NoSQL for inventory management gives them an inventory signal with little to no process latency.
While the performance rankings were based on comparisons of inventory turns, operating margin and Return on Invested Capital (ROIC) for the periods of 2006-2013 and 2009-2013, the concept is that to be a supply chain leader you must outperform and drive improvement. Aligned Metrics. Supply Chain Design.
It is not as simple as trading-off inventory, cost, and customer service. In the Supply Chains to Admire analysis, the focus is to understand the relative performance of a company within a peer group of growth, operating margin, inventory turns, and Return on Invested Capital (ROIC). Comparison To The Gartner Top 25.
The award, based on beating the industry peer group on rate of improvement on the key metrics of growth, operating margin, inventory turns, and Return on Invested Capital (ROIC) while outperforming their peer group, is tough to achieve. The orbit chart below illustrates L’Oréal’s performance at the intersection of two metrics.
ABC Analysis for Inventory Planning : Clustering products that behave similarly highlights issues, challenges, and opportunities for serving customers better. Price index and price elasticity are useful metrics on their own, and a combination of these can help determine the right price point to maximize revenue and profit.
3 Key Metrics for Measuring Supply Chain Performance Beyond Cost Reduction. Inventory measurement is critical and it is money after all in that it took a capital expense to procure. Inventory measurement is critical and it is money after all in that it took a capital expense to procure. Isn’t time important? Read more. .
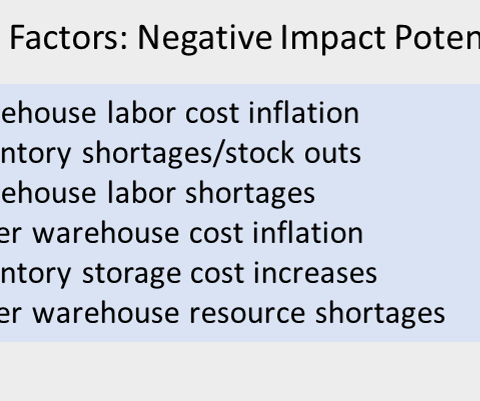
We approached the topic from the perspective of importance in comparison to other objectives and change in importance over time. Inventory shortages/stock-outs was the factor with the second highest negative impact potential for 2023 in our preliminary survey results.
Here are the three questions that I would like people to ask: Table 1: Comparison of Results for Best of Breed Solution Providers to ERP Expansionists in Supply Chain Planning. In addition, I am now done with the page proofs for my new book, Metrics that Matter. The board has not set-up the team for success. The book is a story.
As I mentioned in my previous post, Sales Dashboards – 16 Metrics for Manufacturers , a strategy for measuring business performance should also incorporate metrics that focus on the supply chain and other operational areas of the enterprise. Inventory Turns and Sales-to-Inventory Ratio. DSO – Days Sales Outstanding.
Days Sales of Inventory (DSI) is a key measure to help you understand how efficient your inventory management is. Here explain what DSI is, how to use it, and why it’s crucial to track this metric in your business – whether you’re a retailer, manufacturer, wholesaler or distributor. How do you calculate Average Inventory?
The impact of complexity on inventory is not quick. To help, today I want to share some of the insights from our recent Inventory Optimization study. Inventory management is a hot issue. Companies invest in project after project, yet inventory levels remain the same. The Business Problem. The analogy is weight loss.
Definitions: Oxymoron: The combination of contradictory or incongruous words (such as cruel kindness) Juxtaposition: The act of placing words or concepts close together or side by side, for comparison or contrast. What is the role of inventory? Integrating data does not align an organization motivated by functional metrics.
Companies entered the pandemic with twenty more days of inventory than at the beginning of the great recession. A balance sheet analysis shows that 95% of publicly traded manufacturers are stuck (when compared to peer group) at the intersection of growth and margin, margin and inventory turns, and Return on Invested Capital (ROIC) and growth.
As hospitals adopted consignment planning programs, inventory progress slowed. The turns are the lowest of any industry, and despite investments in technologies and processes, inventory turns have only improved 3%, and Cash-T0-Cash (C2C) cycles have declined 4%. The shift of inventory without the sharing of data is a mistake.
Snow fell last night as I worked on my last Supply Chain Metrics That Matter report. The concept of the Effective Frontier is that best in class companies align functional metrics to balance growth, cost, inventory and Return on Invested Capital (ROIC) performance while balancing customer service metrics.
We have been taught, as supply chain leaders, that over the last decade supply chain processes have improved costs, shortened cycle times, improved customer service and decreased inventory. Based on our recent research, we find that only 1% of process-based companies are making progress on both operating margins and inventory.
The first number in a cell represents the average value for a specific industry for 2010-2016, and the percentage on the second line is a comparison of the average for 2010 when compared to 2016. If the arrow is red, the industry is moving backwards on a metric. Companies, based on culture, tend to focus on singular metrics.
Gartner says that the most common outsourced SCP processes are inventory management, statistical forecasting and service parts planning. Companies moving to BPO in these practice areas are experiencing supply chain improvements in metrics such as inventory turnover and customer service. versus $4.84 per $1000 of revenue).
When it comes to the management of inventory in value chains, frustration abounds. Executive, after executive, lament, “They have purchased many technologies and sponsored many projects to reduce inventories, but they are not seeing results.” Inventory is the culmination of many business decisions. Tracking Progress.
Year after year, well intentioned people toiled against improving metrics that reduced, not improved, the effectiveness of the supply chain. ERP is valuable to improve transactional accuracy, but I can find no evidence that investments in ERP have reduced inventory or improved cash-to-cash cycles. Metricscomparison of Kellogg Co.
In Figure 1, we show the aggregate trend of the chemical industry in an orbit chart format showing year-over-year results at the intersection of two metrics operating margin and inventory turns. inventory turns. for inventory turns define best-in-class performance? for inventory turns define best-in-class performance?
In the Supply Chain Metrics that Matter table, we can clearly see that “operating margin” and “inventory turns” matter to public financial performance. Note the trends in operating margins and inventory turns. Each faces four years of deterioration on this important supply chain metric.
As a result, tor most companies, the goals are unclear and the financial metrics are not well-understood. They do not have a peer group for comparison. We do not include them in the analysis because there is no peer group comparison. This year-over-year comparison, enables visualization of performance on two metrics.
They had to be publicly traded, we had to have a nearly complete data set for the years studied, and they had to have a peer group of at least six companies to be able to draw the comparisons. However, due to a variety of factors, companies are losing ground on driving progress on both inventory turns and operating margin.
Sales, Inventory, Operations Plan (SIOP) is a process within many successful supply chain organizations that recognizes the integral relationship between all departments in the company, but how do you piece together an SIOP process? SIOP stands for “Sales, Inventory, Operations Plan”, not to be confused with “S&OP”.
Without baseline metrics on what you want to improve on and why, how can you be confident your strategy is working? Gathering the necessary data to formulate an accurate comparison between previous results and those provided by machine learning is an excellent way to establish confidence in your results.
The next posts in the series will break down metrics and issues to consider in SQM by industry and conclude with a case study on the application of SQM. 5 Key Metrics to Use for Scoring Supplier Quality Management (From LNS Research ). The definition of this metric is similar to the way it sounds. Cost of quality.
Inventory Turns (15%) (based on 2014 results). Growth 10% (Year-over-Year comparison of 2013 versus 2014). Opinion makes up 50% of the rating; and in the ranking system, company comparisons are against each other with little consideration of industry drivers. Leaders need to balance a portfolio of metrics. It is a HOAX.
As a follow-up to this article, I wanted to talk one-on-one with the leadership teams of the two companies and get their insights on the ten-year comparison. We manage supply chain metrics. We have significant opportunity to strengthen inventory management. Recently, I wrote a blog post that contrasted Colgate and Unilever.
Granular data by volume is a must to be able to manage replenishment, network design, and inventory targets. A simplistic view is that supply chain excellence is the trade-off of cost, inventory and customer service. To maximize value—price to tangible book, functional metrics need to be reset to focus on reliability.
Growth agendas with the spiraling demand require cash, supplier shortages necessitate the shortening of payables, and the longer/more variable transport lead times decrease inventory turns increasing the need for cash. Comparison of Industry Players Within Consumer Goods for the Period of 2012-2021. The answer? The how is tricky.
However, for elements like forecast error, customer service and slow-moving inventory self-reported data is not sufficient. While every company will agree that this data is VERY important, the lack of standard definition precludes comparison. A lag is the comparison against points in time. We then worked on the analysis.
Over the period of 2009-2015 only 88% of companies made improvement on the “Supply Chain Metrics That Matter.” (The The Supply Chain Metrics That Matter are a portfolio of metrics which correlate to higher market capitalization. Inventory Turns. We eliminate the lower 1/3 of companies for the period from consideration.
We organize all of the trending information in your field so you don't have to. Join 102,000+ users and stay up to date on the latest articles your peers are reading.
You know about us, now we want to get to know you!
Let's personalize your content
Let's get even more personalized
We recognize your account from another site in our network, please click 'Send Email' below to continue with verifying your account and setting a password.


Let's personalize your content