This site uses cookies to improve your experience. To help us insure we adhere to various privacy regulations, please select your country/region of residence. If you do not select a country, we will assume you are from the United States. Select your Cookie Settings or view our Privacy Policy and Terms of Use.
Cookie Settings
Cookies and similar technologies are used on this website for proper function of the website, for tracking performance analytics and for marketing purposes. We and some of our third-party providers may use cookie data for various purposes. Please review the cookie settings below and choose your preference.
Used for the proper function of the website
Used for monitoring website traffic and interactions
Cookie Settings
Cookies and similar technologies are used on this website for proper function of the website, for tracking performance analytics and for marketing purposes. We and some of our third-party providers may use cookie data for various purposes. Please review the cookie settings below and choose your preference.
Strictly Necessary: Used for the proper function of the website
Performance/Analytics: Used for monitoring website traffic and interactions
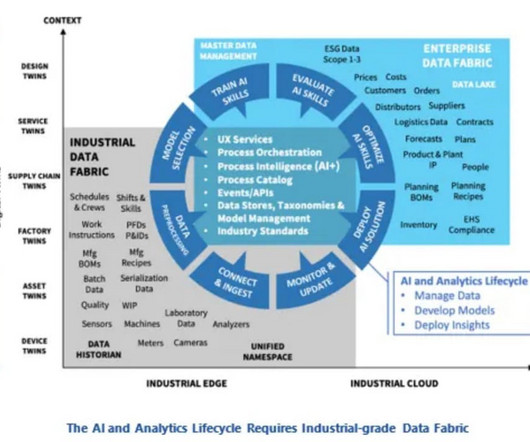
Many global multinationals accelerated their investments in digitizing data during the pandemic. According to Colin Masson, a director of research at ARC Advisory Group, the opportunity to mine these vast quantities of data to achieve business value is “NOW.” Mr. Masson leads ARC’s research on industrial AI and data fabrics.
Open Sky Group, a global leader in supply chain execution solutions, has announced a strategic partnership with Easy Metrics , a premier provider of labor management and warehouse performance management solutions.
In follow-up qualitative interviews, one of the largest issues with organizational alignment was metric definition and a clear definition of supply chain excellence. In my post Mea Culpa, I reference my work with the Gartner Supply Chain Hierarchy of Metrics. Error is error, but is it the most important metric? My answer is no.
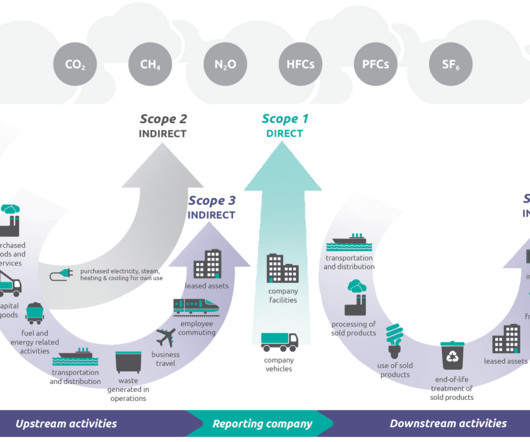
Schneider Electrics new Environmental Data Program gives logistics professionals unprecedented access to carbon and sustainability metrics, covering over 70% of its product turnover. As Craig Resnik writes, Schneider Electric launched its Environmental Data Program to increase transparency around product-level environmental impact.
Multiple industry studies confirm that regardless of industry, revenue, or company size, poor data quality is an epidemic for marketing teams. As frustrating as contact and account data management is, this is still your database – a massive asset to your organization, even if it is rife with holes and inaccurate information.
Creating a data-driven supply chain tracking important transportation metrics helps shippers respond and adapt as quickly as possible to known and unknown events. Why Monitor Transportation Metrics. Actionable data is one of the most critical business drivers.
To improve,” the report rightly notes, “organizations should enhance supply chain visibility with robust data and analytics; use AI to foresee disruptions; keep business continuity plans current; and diversify supply sources, suppliers, manufacturing and logistics partners.” net promoter score or similar metric) as a supply chain KPI.
A lack of standardized ESG metrics across industries and regions makes it challenging to consistently evaluate and compare supplier performance. Data collection and verification remain areas of concern. Legacy procurement systems pose challenges, as they were not designed to capture and manage ESG-related data.
Solvoyo has a metric they call the user acceptance rate. This metric measures the percentage of time the planners accept replenishment, transportation, or inventory plans as they are without any change in the timing of the delivery or the quantity to be delivered. If a user makes changes to the plan, they log that data.
Just by embedding analytics, application owners can charge 24% more for their product. How much value could you add? This framework explains how application enhancements can extend your product offerings. Brought to you by Logi Analytics.
Assessing Infrastructure and Technological Capabilities The first step in the readiness assessment is to evaluate the organization’s IT infrastructure and data management systems. Organizations must also evaluate the quality, integrity, and security of their data to ensure it is reliable enough for DPP purposes.
That’s where data analytics comes in. Modern supply chains thrive on real-time data, execution-focused applications, and dynamic decision-making. In this post, we’ll explore how data analytics can revolutionize your supply chain. Demand Forecasting: Analyze past data to predict future needs.
As regulations across the globe strengthen, the pressure to collect, report, and organize emission-related metrics has never been higher. This added responsibility for companies will have lasting effects on business operations, corporate partnerships, supply chain logistics, compliance requirements, and data integrity.
Samuel Parker and Joe Lynch discuss DAT iQ: the metrics that matter. Shippers, brokers, carriers, news organizations and industry analysts rely on DAT for trends and data insights based on a database of $150 billion in annual market transactions. Source capacity with precision using supply and demand metrics and forecasts.
Teams make recommendations based on latent data to their managers, but decisions are often bogged down in meetings and corporate politics. In this role, you would design data flows to enable self-service planning processes where the planner becomes the orchestrator to help business leaders make the decisions at the speed of business.
Forecasting has evolved into a sophisticated science, combining historical data, real-time market signals, and predictive analytics. Retailers implementing these solutions are seeing improvements in customer engagement metrics and repeat purchase rates.
Supply chain orchestration is about managing the movement of goods, data, and decisions across the entire supply networkstarting with suppliers and continuing through to the customer. Why Orchestration Matters The more connected a supply chain becomes, the more it depends on timely, accurate data and consistent communication across teams.
These sensors capture precise data on factors like location, speed, fuel usage, and driver behavior, transforming fleet management from reactive to data-driven decision-making. The IoT data allows managers to detect inefficiencies, predict maintenance needs, and even assess driver performance.
Shippers, brokers, carriers, news organizations and industry analysts rely on DAT for trends and data insights based on a database of $150 billion in annual market transactions. Real-time Market Insights: DAT provides real-time data on spot market rates, capacity availability, and lane-specific trends, enabling informed decision-making.
This year, a recurring theme that I saw was about using supply chain data to improve the customer experience across the entire value chain. Here are the ones that stood out to me, especially as it relates to supply chain data. The single data cloud runs on Snowflake, one of Blue Yonder’s partners.
Data is the lifeblood of AI in the supply chain. Without sufficient data, AI models can’t uncover meaningful patterns, make accurate predictions, or provide valuable insights for informed decision-making in complex and dynamic environments. At the same time, feeding your AI models too much data can also be a problem.
Drip Big Data. The issue is that when companies optimize functional metrics, they throw the supply chain out of balance and sub-optimize value. To use optimization, the data had to be cleaned and stored in pristine condition in a data jail (rows and columns of traditional database technologies). Industry 4.0.
billion rate data points monthly to provide the most comprehensive view of the market, helping you identify savings opportunities and make data-driven decisions. Our platform can be deployed alongside your current solutions, providing immediate value without disrupting established workflows.
That’s the power of manufacturing data collection. Data transforms operations. Manufacturing data collection is your secret weapon for boosting efficiency, cutting waste, and staying ahead of the competition. Let’s dive in and unlock the potential of your manufacturing data.
That tightly integrated advanced planning (APS) coupled to Enterprise Resource Planning (ERP) using order data is sufficient. Functional Metrics and the Lack of Alignment to Strategy. Few companies are clear on the number of supply chains they operate, design the rhythms and cycles of each, and align metrics to the strategy.
The research methodology for the Supply Chains to Admire compares the performance of a company against its industry peer group for the metrics of Year-over-Year Revenue Growth, Inventory Turns, Operating Margin, and Return on Capital Employed (ROCE). For 80% of industries, the supply chain metrics represent more than 40% impact on value.
With freight transport accounting for a significant share of global emissions, efforts to improve logistics now extend beyond operational metrics to include resilience, regulatory compliance, and climate performance. This shift reflects a broader transition toward data-driven, performance-based management of freight networks.
Client Access & Transparency: Provides client access to their shipping data for increased transparency and decreased administrative overhead. Data-Driven Insights: Provides valuable insights into shipping costs and performance metrics to optimize operations.
VMI has great promise in the use of channel data and the management of flow. Neil’s post in response to my post of Driving Value From Outside-in Planning : In her post, ‘Driving Value from Supply Chain Planning’, Lora Cecere provides great supply chain analysis and benchmarking for her supply chains to admire.
A disruption at any point in the global logistics network including the average of 12 touch points from shipment packaging to final delivery can prove disastrous for profits, service levels, customer loyalty, and other key metrics. With the global e-commerce market predicted to reach $8.1 billion to $23.07
IoT: Powering the Future of Digital Product Passports The Internet of Things (IoT) continues to impact how industries track products and manage data. This network of devices enables seamless, automatic data collection from physical objects in near real-time.
My goal is to convince you to ground supply chain processes and technology implementations in data analysis while tying the results to the improvement in corporate performance. Let me make my point by sharing some financial data using client examples from the last decade. So, I asked the questions, “Is your data forecastable?
Blockchain also facilitates collaboration by sharing verified data across stakeholders. These devices provide actionable data to improve fuel efficiency and reduce maintenance costs. Set Measurable Goals: Establish clear targets for emissions reduction, energy efficiency, and sustainability metrics.
Proactive Security Measures:DAT employs a range of proactive measures, including multi-factor authentication, advanced monitoring tools, and regular security testing, to safeguard user accounts and data, and to prevent fraudulent activities like identity theft and double brokering.
The systems–based on shipment and order data–were out of step with the market. With fixed models and hard-wired data feeds, teams could not adjust the planning systems to use consumption data or market indicators. Next Steps: Start to model demand based on market data to align the organization on baseline demand.
KPIs: More Than Metrics – They’re Tools for Change was first posted on December 4, 2024 at 11:02 am. Learn how to design effective supply chain KPIs that drive organization change, align teams, and improve performance with actionable insights.
Leading organizations are building supply chains that are less exposed to single points of failure, more informed by real-time data, and more able to adjust sourcing, inventory, and routing based on current conditions. Metrics must reflect the new priorities. The Shift Toward Resilience The strategic conversation is beginning to shift.
For example, if an asset issue was detected, solving that issue could involve multiple applications used by multiple people, seeing different information, entering different data, bouncing emails and texts back and forth, and moving information from one place to another. We needed to model the data in a way that we can do simple searching.
A shift from functional metrics to a balanced scorecard. I like the use of growth, margin, inventory turns, Return on Invested Capital, customer service and ESG metrics. The focus on functional metrics sub-optimizes balance sheet results. Funny, isn’t it? Bad News and Good News Travel at the Same Velocity.
Using balance sheet data from 2011 to 2019, we chart companies’ progress by peer group on rate of improvement and performance in the metrics of growth, operating margin, inventory turns, and Return on Invested Capital (ROIC). The charts and data get boring pretty quick.) The reason?
Most S&OP efforts break down due to disconnected systems, siloed data, and a lack of cross-functional engagement. According to Gartner , early stages of S&OP maturity often lack formal processes, metrics, and cross-functional participation. Sales & Operations Planning must be executable, data-driven, and collaborative.
We’ll examine the key components of efficient supply chains, explore essential performance metrics, and uncover the fundamental drivers that influence efficiency. Distribution: Data-driven distribution networks utilize advanced routing and scheduling to ensure timely deliveries while minimizing transportation expenses.
How do we design work systems to align organizations and ensure that there is the right balance of reward systems with metrics? Is there a need to redesign metrics to move from a functional and traditional function to drive goal alignment? In the design of the digital program, spend time on metrics and reward systems.
Real-Time Social Listening Integration Traditional supply chain planning relies heavily on historical transactional data, which inherently delays responses to rapidly shifting customer preferences. Today’s advanced demand planning systems treat weather conditions as causal factors alongside pricing, promotions, and store traffic.
We organize all of the trending information in your field so you don't have to. Join 102,000+ users and stay up to date on the latest articles your peers are reading.
You know about us, now we want to get to know you!
Let's personalize your content
Let's get even more personalized
We recognize your account from another site in our network, please click 'Send Email' below to continue with verifying your account and setting a password.


Let's personalize your content