This site uses cookies to improve your experience. To help us insure we adhere to various privacy regulations, please select your country/region of residence. If you do not select a country, we will assume you are from the United States. Select your Cookie Settings or view our Privacy Policy and Terms of Use.
Cookie Settings
Cookies and similar technologies are used on this website for proper function of the website, for tracking performance analytics and for marketing purposes. We and some of our third-party providers may use cookie data for various purposes. Please review the cookie settings below and choose your preference.
Used for the proper function of the website
Used for monitoring website traffic and interactions
Cookie Settings
Cookies and similar technologies are used on this website for proper function of the website, for tracking performance analytics and for marketing purposes. We and some of our third-party providers may use cookie data for various purposes. Please review the cookie settings below and choose your preference.
Strictly Necessary: Used for the proper function of the website
Performance/Analytics: Used for monitoring website traffic and interactions
Open Sky Group, a global leader in supply chain execution solutions, has announced a strategic partnership with Easy Metrics , a premier provider of labor management and warehouse performance management solutions.
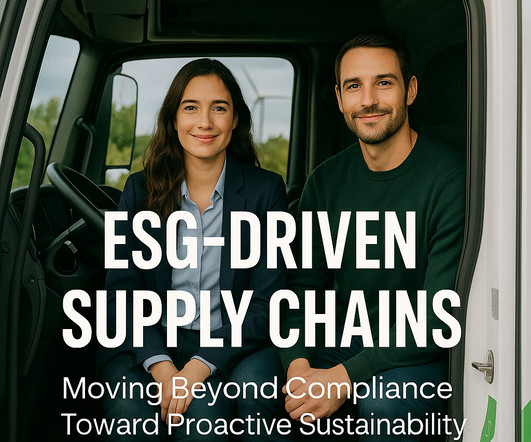
While past efforts focused on meeting compliance requirements, organizations are now working to proactively embed environmental, social, and governance (ESG) principles into their sourcing, production, and distribution activities. Integrating ESG principles into supply chains presents technical, operational, and financial challenges.
Use of Supply Chain Descriptors Most organizations are locked into functional silos driven by functional metrics. Stuck in a rut, supply chain leaders try to punch their way through a set of conflicting metrics and priorities each day. The metrics defining success in manufacturing and procurement do not align.
The research methodology for the Supply Chains to Admire compares the performance of a company against its industry peer group for the metrics of Year-over-Year Revenue Growth, Inventory Turns, Operating Margin, and Return on Capital Employed (ROCE). For 80% of industries, the supply chain metrics represent more than 40% impact on value.
Just by embedding analytics, application owners can charge 24% more for their product. How much value could you add? This framework explains how application enhancements can extend your product offerings. Brought to you by Logi Analytics.
billion rate data points monthly to provide the most comprehensive view of the market, helping you identify savings opportunities and make data-driven decisions.
Memos were sent to typing pools to be distributed by inter-office mail. When computers were distributed to managers, Evelyn and Rose were scared. Form and socialize your own hierarchy of metrics. Here is the metrics framework that I am using at present in my outside-in classes. At that time, there was no email.
While Joe is trying to balance the feedback from Filipe and Frank, he is often asked to change his metric targets by his CFO named Lou. After two years of research, I think that we throw the supply chain out of balance and limit its potential through the use of traditional and functional metrics. Achieving Balance in Metrics.
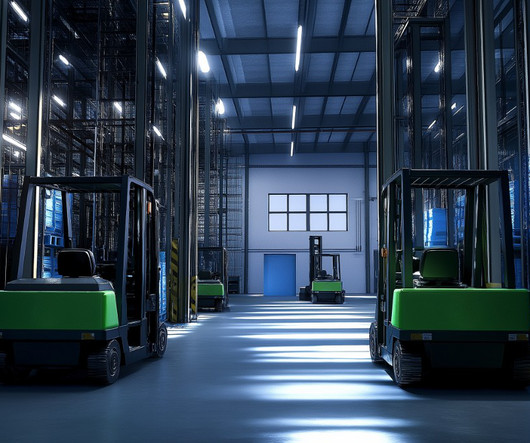
Renewable Energy for Facilities: Warehouses and distribution centers can integrate solar panels and wind turbines to lower energy costs and carbon footprints. Set Measurable Goals: Establish clear targets for emissions reduction, energy efficiency, and sustainability metrics.
The issue is that when companies optimize functional metrics, they throw the supply chain out of balance and sub-optimize value. There is no unifying data model to align procurement and manufacturing, transportation and distribution, revenue management and demand planning, or sales account teams with supply chain planning.
As warehousing undergoes a fundamental shift with the onslaught of e-commerce, it’s imperative that organizations identify the specific drivers that impact performance, establish e-commerce-relevant metrics, and continually monitor performance to navigate this transition successfully.
Centralized distribution strategies may be efficient under normal conditions, but they often leave little room to reroute when disruptions occur. Metrics must reflect the new priorities. When a critical Tier-2 supplier is affected by a tariff policy change or regional shutdown, the ripple effects often catch manufacturers by surprise.
I was promoted to run the warehouse, and at the time, I had no experience in distribution, but was asked to run the largest distribution center in the system. They were not aligned on the role of the distribution as it tied to supply chain excellence. The metrics were not aligned. They reported to a man named Tony.
We’ll examine the key components of efficient supply chains, explore essential performance metrics, and uncover the fundamental drivers that influence efficiency. Distribution: Data-driven distribution networks utilize advanced routing and scheduling to ensure timely deliveries while minimizing transportation expenses.
Sobeys addressed these integration challenges by using Samsara’s platform to unify operations across its distribution network, enabling it to coordinate activities and achieve efficiencies. Protecting sensitive data—such as vehicle locations, driver information, and operational metrics—requires rigorous cybersecurity measures.
We consistently see that companies focused on functional excellence–a focus within a functional silo like manufacturing, transportation or distribution– or singular metrics– like inventory or costs– underperform against their peer groups. Reward teams for cross-functional metrics. What did we find?
The obvious danger of this is that business rules and data governance often don’t exist from department to department or user to user, leaving an overall picture into the health of the business that is foggy because KPIs and metrics do not correlate across the organization. A great example of this comes from a Logility customer.
Microsoft Datacenters comprise a globally distributed infrastructure designed to power the Microsoft Cloud. They achieved significant carbon reductions in their cloud supply chain by creating a model that looked at the forward positioning of inventory, freight consolidation opportunities, and where to build the distribution centers.
What is the Perfect Delivery Metric? Improving on this metric will always involve a focus on people and processes, but often also includes implementing new, more robust, supply chain applications. The wrong metrics drive suboptimal behaviors and metrics can often be manipulated.
billion rate data points monthly to provide the most comprehensive view of the market, helping you identify savings opportunities and make data-driven decisions.
How do we design work systems to align organizations and ensure that there is the right balance of reward systems with metrics? Is there a need to redesign metrics to move from a functional and traditional function to drive goal alignment? In the design of the digital program, spend time on metrics and reward systems.
Catalyst Phase Overview The Catalyst Phase is the execution stage where the selected distributor(s) are integrated into your distribution network and the strategies developed during the blueprint phase are put into action. Track metrics such as sales volume, market share, inventory levels, and customer satisfaction.
An effective supply chain inventory optimization strategy balances optimal stock levels with minimal costs while ensuring product availability and safeguarding exceptional customer experiences. First, a sophisticated analysis and decision-making process, that incorporates real-time data and requirements.
Performance Management Having just three key metrics at each organisational level is a good idea for performance management in logistics. A CEO doesn’t need to know every single picking accuracy percentage in the warehouse – you simply need the high-level metrics that tell you if your supply chain is healthy.
Combine data from: Enterprise Resource Planning (ERP) systems Transportation Management Systems (TMS) Warehouse Management Systems (WMS) Internet of Things (IoT) sensors Supplier portals Customer relationship management systems (CRM) Performance Metrics and KPIs Performance metrics measure how effective your supply chain is.
These systems also support phased implementation, allowing you to start with high-priority processes, train staff during regular work hours, deploy your wireless infrastructure before software rollout, maintain parallel systems during the initial transition, and closely monitor performance metrics.
Want to streamline your distribution operations? The field of distribution operations is rapidly evolving with the rise of eCommerce, with fierce competition between distributors. A well-designed Distribution Operations strategy can help businesses optimize their supply chain, reduce costs, and improve customer satisfaction.
The goods flow through 2 import centers, 14 strategically located distribution centers in North America, 66 final mile shipping hubs, and nearly 1,700 branch locations. million square feet in 10 distribution centers and 35 million square feet across its branch network. The company has shown sustained improvement on this metric.
Despite legislation, in 2022, the world generated 62 million metric tons of e-waste, according to the United Nations Global E-waste Monitor. million 40-metric-ton trucks which, if placed bumper-to-bumper, would form a line long enough to wrap around the equator. This waste could fill more than 1.5
I had managed factories and distribution centers, and strongly believed that the best supply chain results stemmed from strong, well-run functions. Instead, we found that the companies with the lowest total supply chain cost (a total of source, make and deliver) had average costs in manufacturing and distribution. It was not measured.
Price index and price elasticity are useful metrics on their own, and a combination of these can help determine the right price point to maximize revenue and profit. Since there are often differences in store sizes, a metric representing the size can be added as well for a two-dimensional clustering approach. Asena holds B.S.
In essence, this includes the entire chain of supply, production, storage, distribution and finally, the customer, so that the plans make sense all involved parties. Ultimately, what KPIs, as metrics and indicators derived from the set of plans are taken into account and prepared for each scenario. Technology for Effective Planning.
To monitor supply chain performance, stakeholders of successful companies typically define supply chain metrics that are relevant to the given business and track these KPIs regularly. By setting benchmarks for metrics, analysts can recognize unsettling trends and take preventive measures on time.
The script will be distributed to CFOs of apparel, consumer packaged goods, and food/beverage companies next week. Aligned Metrics. Attending the conference was Alexia Howard, Senior Research Analyst – US Foods for Sanford C. Bernstein & Co., So, I wanted to give you a heads-up on their questions, and my answers.
The award, based on beating the industry peer group on rate of improvement on the key metrics of growth, operating margin, inventory turns, and Return on Invested Capital (ROIC) while outperforming their peer group, is tough to achieve. The orbit chart below illustrates L’Oréal’s performance at the intersection of two metrics.
This blog explains The Key MRP Metrics in Supply Chain whcih every supply chain professional in Manufacturing or Distribution Businesses. The metrics that underpin MRP could be described as the balls in this juggling act. This article takes an in-depth look at the crucial metrics every supply chain professional needs to know.
Today, only 58% of retailers have a good PI signal in their stores, and only 60% have a good PI signal in their distribution centers. Some of the packages on the trucks moving right now are the first shipments of Metrics that Matter. Foundational for ecommerce is a real-time perpetual inventory (PI) signal. Don’t fool yourself.
These delayed bolts disrupt multiple links, from production to sales to distribution, and more. And the linked nature of supply chains mean that collaboration is necessary to ensure that a solution to a problem doesn’t meet the metrics for one link but negatively impact another.
The second phase involved Mohawk extending their new supply chain improvements out to its distribution network. It also handles requirements planning, resupply of regional (level two) Distribution Centers (DCs) and passes manufacturing replenishment requirements to the production scheduling system.
We speak about the need to move from a functional understanding to a global, holistic capabilities, but the traditional supply chain leader defines bonus incentives and process performance goals based on functional metrics. Measurement. Organizations speak of the bullwhip, but don’t measure it or monitor the effects. Innovation.
The supply chain planning cannot be effective if implemented by a supply chain function that is focused only on customer service, logistics and distribution. In addition, I am now done with the page proofs for my new book, Metrics that Matter. Instead, he wants to drive supply chain excellence and build the metrics that matter.
New solutions for material handling and finished product distribution are often required. Production Capacity Analysis While traditional testing methods can be time-consuming and offer incomplete data, focusing on key production metrics within the manufacturing process provides more actionable insights.
A planner could ask the SCP engine to achieve 95% service, with CO2 emissions under of under a million metric tons at a given factory in the coming month. The IBP plans are sent to the plants with what needs to be manufactured and to distribution on what needs to be shipped to customers. This would be a three-way tradeoff. No plan is.
You can also consider setting up regional distribution centres to reduce long haul transportation, and hybrid or electric vehicles for last mile delivery where possible. Testing alternative methods and modes of distribution, and quantifying the potential emissions reduction.
We organize all of the trending information in your field so you don't have to. Join 102,000+ users and stay up to date on the latest articles your peers are reading.
You know about us, now we want to get to know you!
Let's personalize your content
Let's get even more personalized
We recognize your account from another site in our network, please click 'Send Email' below to continue with verifying your account and setting a password.


Let's personalize your content