This site uses cookies to improve your experience. To help us insure we adhere to various privacy regulations, please select your country/region of residence. If you do not select a country, we will assume you are from the United States. Select your Cookie Settings or view our Privacy Policy and Terms of Use.
Cookie Settings
Cookies and similar technologies are used on this website for proper function of the website, for tracking performance analytics and for marketing purposes. We and some of our third-party providers may use cookie data for various purposes. Please review the cookie settings below and choose your preference.
Used for the proper function of the website
Used for monitoring website traffic and interactions
Cookie Settings
Cookies and similar technologies are used on this website for proper function of the website, for tracking performance analytics and for marketing purposes. We and some of our third-party providers may use cookie data for various purposes. Please review the cookie settings below and choose your preference.
Strictly Necessary: Used for the proper function of the website
Performance/Analytics: Used for monitoring website traffic and interactions
In today’s architectures and functional metrics, value optimization does not exist. In current systems where Distribution Requirements Planning (DRP) and Transportation Management (TMS) are different models, alignment is impossible. The data outcome is open source and can be used to improve project outcomes. You are right.
While past efforts focused on meeting compliance requirements, organizations are now working to proactively embed environmental, social, and governance (ESG) principles into their sourcing, production, and distribution activities. Building supplier capabilities while maintaining sourcing flexibility requires additional investment.
Proactively adopting cleaner energy sources ensures alignment with these evolving regulations. The industry’s dependency on traditional energy sources necessitates an urgent shift toward cleaner alternatives. Transparent sourcing practices build trust among consumers and investors.
As the global organization developed, companies increased their dependency on third-party manufacturing and distribution (increasing latency) without investing in value network technologies. Inventory is both our most important buffer and greatest source of waste.) Muda comes from many sources. The difference is opportunity.
Just by embedding analytics, application owners can charge 24% more for their product. How much value could you add? This framework explains how application enhancements can extend your product offerings. Brought to you by Logi Analytics.
It creates a single source of truth for your rate management, automating RFQs and streamlining the entire procurement process. billion rate data points monthly to provide the most comprehensive view of the market, helping you identify savings opportunities and make data-driven decisions.
Reducing cost was the primary objective, and most operational decisionsfrom sourcing to fulfillmentreflected that mindset. Centralized distribution strategies may be efficient under normal conditions, but they often leave little room to reroute when disruptions occur. Metrics must reflect the new priorities.
Do Set Clear KPIs and Governance Structures : Establish transparent metrics for sales, coverage, and service levels. Tags: Route to Market , Michael Thompson , Distribution , RtM Strategy , The ABC of RtM Subscribe Here! Do Invest in Distributor Capability Building : Provide training, digital tools, and performance incentives.
The issue is that when companies optimize functional metrics, they throw the supply chain out of balance and sub-optimize value. We have not designed the planning systems to serve managers, directors, and vice presidents, aiming to improve decision-making and collaboration across the source, make, and deliver processes.
The research methodology for the Supply Chains to Admire compares the performance of a company against its industry peer group for the metrics of Year-over-Year Revenue Growth, Inventory Turns, Operating Margin, and Return on Capital Employed (ROCE). For 80% of industries, the supply chain metrics represent more than 40% impact on value.
We’ll examine the key components of efficient supply chains, explore essential performance metrics, and uncover the fundamental drivers that influence efficiency. Distribution: Data-driven distribution networks utilize advanced routing and scheduling to ensure timely deliveries while minimizing transportation expenses.
We consistently see that companies focused on functional excellence–a focus within a functional silo like manufacturing, transportation or distribution– or singular metrics– like inventory or costs– underperform against their peer groups. Reward teams for cross-functional metrics. What did we find?
At a high level, procurement focuses on sourcing the goods and services an organization needs, while supply chain management oversees the broader flow of those goods, from raw materials to end customers. Supply Chain Management (SCM) involves orchestrating a product’s or service’s entire lifecycle, from sourcing and production to delivery.
The relationship between corporate financial performance and supply chain metrics was complex; and in my first attempts, I was unable to derive a correlation. The year 2012 marked the 30th anniversary of the use of supply chain management as a cross-functional process for source, make and deliver in the commercial sector. Definitions.
It creates a single source of truth for your rate management, automating RFQs and streamlining the entire procurement process. billion rate data points monthly to provide the most comprehensive view of the market, helping you identify savings opportunities and make data-driven decisions.
What is the Perfect Delivery Metric? Improving on this metric will always involve a focus on people and processes, but often also includes implementing new, more robust, supply chain applications. The wrong metrics drive suboptimal behaviors and metrics can often be manipulated.
It’s the key to transforming your supply chain from a source of frustration into a well-oiled, profit-generating machine. Implementing Data Analytics for Supply Chain Success Data analytics transforms supply chains with precise insights and real-time monitoring by bringing together multiple data sources. The result?
Collaborative discussions can help identify relevant data sources and metrics that capture the end-to-end supply chain process and align with overall business goals. Data inventory and assessment: Conduct a comprehensive inventory of available data sources within the organization, including internal systems (e.g.,
The team was organized around the functional silos of source, make and deliver. I had managed factories and distribution centers, and strongly believed that the best supply chain results stemmed from strong, well-run functions. When all functions are jointly focused on improving these metrics, then we can have one team.
The company sources goods from 34,000 suppliers out of 30 nations. The goods flow through 2 import centers, 14 strategically located distribution centers in North America, 66 final mile shipping hubs, and nearly 1,700 branch locations. million square feet in 10 distribution centers and 35 million square feet across its branch network.
3 Key Metrics for Measuring Supply Chain Performance Beyond Cost Reduction. 10 Soft Metric Considerations in Measuring Supply Chain Performance. Twitter Google+ LinkedIn The post 3 Core Metrics & 10 Soft Metrics for Measuring Supply Chain Performance appeared first on Transportation Management Company | Cerasis.
Price index and price elasticity are useful metrics on their own, and a combination of these can help determine the right price point to maximize revenue and profit. Since there are often differences in store sizes, a metric representing the size can be added as well for a two-dimensional clustering approach. Asena holds B.S.
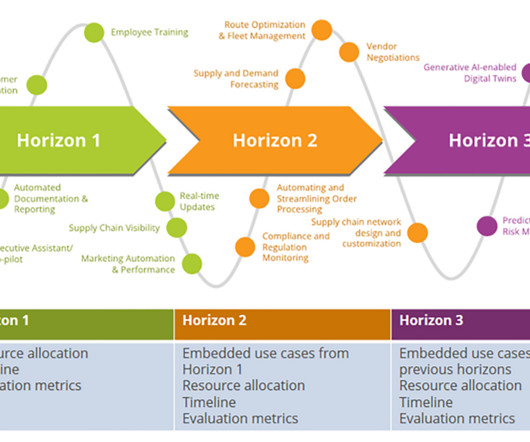
Whether you’re managing a distribution center, coordinating fleet operations, or shaping global supply strategy, understanding how to deploy and scale digital twins may be your next competitive edge. Mitigation best practices include cross-functional pilots, strong executive sponsorship, and early wins tracked with business metrics.
The script will be distributed to CFOs of apparel, consumer packaged goods, and food/beverage companies next week. Aligned Metrics. How do you balance the trade-offs between source, make and deliver? Attending the conference was Alexia Howard, Senior Research Analyst – US Foods for Sanford C. Bernstein & Co.,
Image: iStock/JuSun June 18, 2025 Helen Atkinson, Managing Editor “The future is already here; it’s just not evenly distributed,” wrote William Gibson in his 1984 novel Neuromancer.
As product flows rapidly shifted and hard baked assumptions about lead times and sourcing locations were put to test, users across many organizations bypassed their planning systems and turned to excel sheets, internal data science teams or non-traditional supply chain vendors who could deliver AI based solutions at a faster turn.
These systems also support phased implementation, allowing you to start with high-priority processes, train staff during regular work hours, deploy your wireless infrastructure before software rollout, maintain parallel systems during the initial transition, and closely monitor performance metrics.
This week, at Supply Chain Insights LLC, we published our 11th report in the series titled Supply Chain Metrics That Matter. When companies look at singular metrics (labor costs or inventory), they have moved backwards. Aligning metrics matters. Functional metrics in isolation degrade value.
Apple Inc purchases raw materials from various sources then get them shipped to an assembling plant in China. For other distribution channels such as retail stores, direct sales and other distributors, Apple Inc will keep products at Elk Grove, California (where central warehouse and call center are located) and supply products from there.
Current planning taxonomies do not plan across make, source, and deliver answers bi-directionally. For example, there is no commonality between Distribution Requirements Planning (DRP) and Transportation Planning (TMS) Real-time Planning: Planning by definition will not and should not be real-time. I don’t think so.
These emissions span every link in the supply chain, from upstream farming to downstream distribution, creating a complex and often fragmented data landscape.Yet more than half of companies still rely on spreadsheets and manual tools to navigate this complexity. These outdated methods are inefficient, error-prone, and difficult to scale.
Over the last decade, the role of the manufacturing and distribution CFO has undergone a profound shift. The modern CFO nee ds to understand digital technologies and their impact, and those who do so will become the key source for data-driven decision making and drive their organizations to be more agile, dynamic, and successful.
To monitor supply chain performance, stakeholders of successful companies typically define supply chain metrics that are relevant to the given business and track these KPIs regularly. By setting benchmarks for metrics, analysts can recognize unsettling trends and take preventive measures on time.
The next posts in the series will break down metrics and issues to consider in SQM by industry and conclude with a case study on the application of SQM. 5 Key Metrics to Use for Scoring Supplier Quality Management (From LNS Research ). The definition of this metric is similar to the way it sounds. Cost of quality.
The company said that it used 85,916 metric tons of single-use plastic that year, an 11.6 Walmart announced that it will pilot agriculture technology with crop supply intelligence company Agritaskto get real-time information on crops and improve sourcing decisions around produce. distribution centers. percent decrease from 2021.
Digital commerce efficiently requires the digitalization of many customer-facing operations and sourcing and procurement. Supply chain planning involves interaction with different types of information based on internal and external data sources. These data sources are often spread across multiple platforms and come in various formats.
Shift towards self-contracting and self-distribution: With health systems gaining significant scale and wanting more control over their supply chain, this shift is accelerating. Quite often there can be a general lack of spend and vendor management and strategic sourcing activities. With such growth comes supply chain complexity.
The Cardinal Health Supply Chain Cardinal Health’s medical segment manufactures, sources and distributes Cardinal Health branded medical, surgical and laboratory products. The medical segment’s supply chain consists of 61 North American distribution centers and 27 global manufacturing plants.
To enhance their competitive edge, companies across industries are adopting a key tactic: strategic sourcing. Strategic sourcing is a holistic approach to supply chain management that includes tactics for optimizing the total cost of ownership, improving supplier relationships, and ensuring long-term value creation.
New solutions for material handling and finished product distribution are often required. Production Capacity Analysis While traditional testing methods can be time-consuming and offer incomplete data, focusing on key production metrics within the manufacturing process provides more actionable insights.
Breaking Boundaries: Exploring Generative AI’s Impact on Supply Chains Supply chains encompass many interconnected activities, from procurement, production, and inventory management, to logistics and distribution. These activities involve numerous stakeholders, such as suppliers, manufacturers, distributors, and retailers.
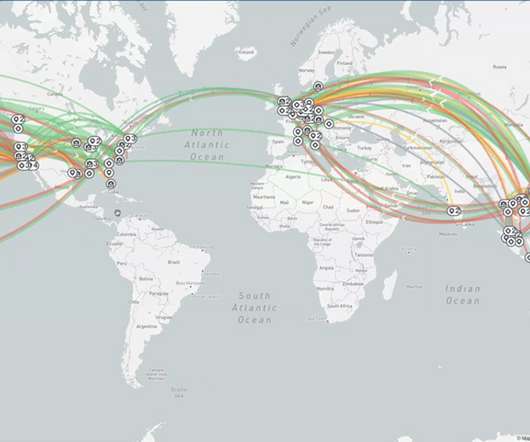
Many-to-many can also refer to many participants in a network accessing many, many sources of event data critical to supply chain operations through a public cloud network. The channel ecosystem network encompasses roughly 1 million distribution, reseller, and retailer partners. COVID of course taught companies the need for agility.
Without baseline metrics on what you want to improve on and why, how can you be confident your strategy is working? And because machine learning systems get smarter over time, having a consistent method of measurement is even more important to ensure you can accurately track how outcomes and ROI are improving against established metrics.
We organize all of the trending information in your field so you don't have to. Join 102,000+ users and stay up to date on the latest articles your peers are reading.
You know about us, now we want to get to know you!
Let's personalize your content
Let's get even more personalized
We recognize your account from another site in our network, please click 'Send Email' below to continue with verifying your account and setting a password.


Let's personalize your content