This site uses cookies to improve your experience. To help us insure we adhere to various privacy regulations, please select your country/region of residence. If you do not select a country, we will assume you are from the United States. Select your Cookie Settings or view our Privacy Policy and Terms of Use.
Cookie Settings
Cookies and similar technologies are used on this website for proper function of the website, for tracking performance analytics and for marketing purposes. We and some of our third-party providers may use cookie data for various purposes. Please review the cookie settings below and choose your preference.
Used for the proper function of the website
Used for monitoring website traffic and interactions
Cookie Settings
Cookies and similar technologies are used on this website for proper function of the website, for tracking performance analytics and for marketing purposes. We and some of our third-party providers may use cookie data for various purposes. Please review the cookie settings below and choose your preference.
Strictly Necessary: Used for the proper function of the website
Performance/Analytics: Used for monitoring website traffic and interactions
Compared to peer group performance for 2013-2023, 59% of the Gartner Top 25 score below their peer group on average revenue growth, 41% below inventory turns, and 41% below their sector on invested capital. The celebrated group is doing the best on the operating margin, where only 24% rank below their peer group.
By charting the performance against peer groups, I could see the story. The first step was to find a reliable data set and establish the peer groups. We purchase data from Y charts. (A The second step of establishing peer groups was trickier. There is no perfect methodology, and the peer group discussions continue.
If so, optimizing your inventory management strategy can be a game-changer. This method offers a solution to various inventory and shipping challenges for businesses just like yours. Below, we outline three ways blind shipping can help optimize your logistics, keep inventories healthy and save you money!
The award, based on beating the industry peer group on rate of improvement on the key metrics of growth, operating margin, inventory turns, and Return on Invested Capital (ROIC) while outperforming their peer group, is tough to achieve. Orbit Chart for L’Oréal at the Intersection of Inventory Turns and Operating Margin.
The Company was attempting to gain economies of scale by grouping manufacturing technologies within a common infrastructure to reap the benefits of a co-generation facility, a centralized warehouse, and a talented administrative team. In my forty years of studying supply chain planning, the groups became larger, but with questionable results.
Most of the business networks were hollowed out by venture capitalists or purchased by opportunists. Yawn and walk on if the answer is i mproving demand error or reducing inventory levels. Each attendee will receive an orbit chart packet with a comparison to their peer group. The business network market is in need of innovation.)
Each executive has a different perspective on the definition of supply chain excellence, but they are never discussed and aligned. His organization purchased an advanced planning technology from well-known best of breed provider, and the implementation should have been successful, but it was not. What Is The Ring of Fire?
How Do You Define Excellence? In retrospect, I find that technology is an enabler, but only if we are clear on what defines supply chain excellence. Many believe that an ex-supply chain exec knows the definition of supply chain excellence. An average margin of 21% with inventory turns of 1.58 I admit it. Lora was as well.
Supply chain excellence is easier to say than to explain. At each company, there is a relationship between the metrics of growth, margin, inventory, customer service, and asset strategy. Keith was an undisputed leader in building talent to drive manufacturing excellence. Business leaders are action-oriented and competitive.
I am currently doing research on inventory management. In the research, I ask inventory planners to define resilience. Of the twenty companies interviewed, only one can answer the question, “Do you have a good inventory plan?” No technology in the market measures inventory health. Today, this is not the case.
In follow-up qualitative interviews, one of the largest issues with organizational alignment was metric definition and a clear definition of supply chain excellence. To manage continuous improvement, companies need a clear definition of excellence and organizational alignment to that goal. They do not excel in planning or forecasting.
Aptean is orchestrating the Blue Yonder/E2open/Infor playbook of buying undervalued assets and milking the maintenance and Software-as-a-Service contracts with existing customers. This is despite the strengths of the recent purchase of Optimity. Is it any wonder that this press release published on Friday afternoon?
If S&OP efforts were that effective, don’t you think that we would have made more progress against inventory levels, margin, and growth? The issues are largely rooted in politics and the lack of clarity on supply chain excellence. Or planned orders to purchase orders?) And how do we measure it? (Is I don’t know.
Groupthink is a psychological phenomenon that occurs within a group of people in which there is a desire for harmony within the group, but the result is an irrational or dysfunctional outcome. I feel that the industry is engaged in ‘Group Think’ No one in this meetings is going to ask tough questions.
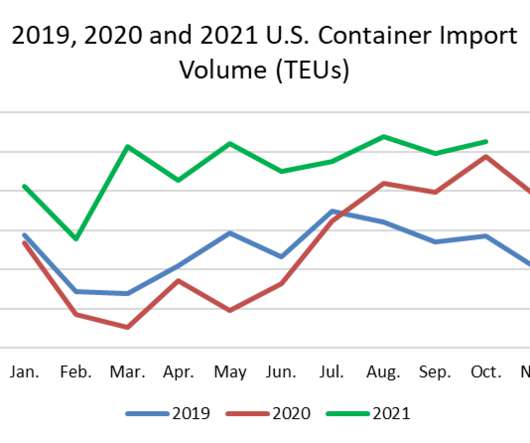
import volumes still climbing (see Figure 1), limited processing capacity at key West Coast ports and the International Longshore and Warehouse Union (ILWU) contract expiring next summer, importers will be scrambling to maintain the inventory they need to support the demand increase. The post Is it too Early For 2022 Predictions?
The classical approach involves functional silos, sequential decisions, and Excel and people to render a plan executable. CPG companies that utilize an autonomous supply chain technology see a reduction in their inventory and cost and an increase in revenue. each with discrete plans generated typically in sequential batch runs.
Nick Lynch is the Global Excellence Manager at Shell Lubricants, a division of Shell Global. The Company implemented SAP Advanced Planner and Optimizer (APO) including the standard functionality of Demand Planning (DP), Supply Network Planning (SNP), and Production Planning and Detailed Scheduling (PPDS), yet many planners also used Excel.
With slim margins and ever-increasing inventories, companies invested less in capital assets. Today, this network operates with less capacity and ballooning inventories. Many of these outsourced products have demand latency of weeks and months (shelf purchase through the replenishment cycle for a manufacturer to receive an order).
The platinum medal puts RS Group in the top 1% of the 100,000-plus rated companies assessed by EcoVadis with each company rated on the material sustainability risks and issues for size, location, and industry. ESG Report: FY24 www.rsgroup.com/media/bsocsl4m/rs-group-esg-h1-highlights-pack_-november-23.pdf million customers.
It was a story where people believed that functional excellence leads to supply chain superiority. I strongly feel that a blind focus on functional excellence will cause the supply chain to become out of balance. The peer groups are growing more and more complex. One that is going to eat you up! Both are more volatile.
Tom, the colorful warehouse manager, constantly heckled Frank for the increasing inventory levels while Ed, the quiet material/logistics manager, constantly questioned if there was a better way. He felt that inventory was no problem, he would just cut it at the end of each quarter to make the balance sheet goals.
For the past five years, the team at Supply Chain Insights identified Supply Chains to Admire Award Winners by analyzing performance by peer group on the key metrics of growth, operating margin, inventory turns and Return on Invested Capital (ROIC). Note the balanced results of Rockwell Automation against their peer group.
Gartner purchased the firm in 2010.) Driving Improvements in Supply Chain Excellence. He felt strongly that supply chain leaders knew how to drive supply chain excellence and needed a forum– or maybe two or three depending on the business model– to help them network and refine their approaches. I disagreed.
Or agreement on the definition of supply chain excellence. As a result, functional excellence anchors action. The focus is on digitization—automating today’s processes—versus rethinking process excellence based on the art of the possible. In this case, the metrics are operating margin and inventory turns.
When it comes to the management of inventory in value chains, frustration abounds. Executive, after executive, lament, “They have purchased many technologies and sponsored many projects to reduce inventories, but they are not seeing results.” Inventory is the culmination of many business decisions.
Companies that outperform their peer groups have supply chain executives with a better understanding of supply chain management. Last week, the Wall Street Journal reached out to discuss the rising inventories near the Port of Los Angeles. In my share groups, large manufacturing clients have a Q1 freeze on travel. The second?
While companies that supply chain leaders believe are top performers– J&J, P&G, and Unilever– do not outperform their peer group. I list sixteen in Table 2, but of the 29 companies listed in the Gartner Top 25, 27 underperform their peer group sector. Is this success? Is this success? I don’t think so.
Pharmaceutical companies are struggling with falling margins and rising inventories. Over the last decade, neither the pharmaceutical nor medical device manufacturer has been able to drive the revenue/employee productivity gains of their comparative peer groups. It is rising inventory levels. The level of growth is a surprise.
How do they buy from you? How do they buy from you?” Spinnaker Management Group asked me to co-present on a demand-driven webinar with SanDisk. Instead, in the SanDisk journey , they adjusted the speed of response to their customer segments, and actively designing inventory postponement strategies. It is systemic.
My thought was to combine my experience working on visibility solutions with Descartes Systems Group and Manugistics with recent research data. The secondary problem is the lack of definition of process requirements and a buying team that cannot see past simple MRP/MRP II/DDMRP requirements. I thought it would be easy.
Mr. Tamma is the chief digital officer at Pirelli and oversees the digital department at Pirelli at the group level. Pirelli needed to move from using an army of representatives visiting dealer sites, showing them massive catalogs, and saying to the dealer, “You could buy this or this or this.” Supply chain projects depend upon data.
Reason #4 Making key decisions by modelling the supply chain in Excel. Reason #6 Not effectively managing inventory. One example that I’ve seen several times is around inventory targets. The result is a lower inventory level, but much higher expedited costs and reduced customer service. There can be multiple reasons.
Bonuses and incentives align with functions and are often counter productive to driving supply chain excellence. Today, over 90% of companies have deployed ERP and APS, but as shown in Table 1, inventory levels have grown not decreased in over 80% of industries studied. Days of Inventory by Industry Across Years.
At the end of a long day of a strategy session on supply chain excellence with a client, I needed to fill up some time in an agenda. The strategy day owner was a global process center of excellence leader. The group felt that the discussion was academic: and not that important. The result? Background.
So, the parking spots are getting more and more occupied with drop trailers, meaning lot capacity shrinks while finding the trailer with the highest-priority inventory becomes even harder. Create a facilities “Center of Excellence.” Problem number three: appointment scheduling is a mess.
<Bear with me… > Here I share a nine-step process in an attempt to help companies unravel the process for buying supply chain planning software. They center on how to make a good decision in the purchase of supply chain planning solutions. Most have purchased software, but are dependent on Excel spreadsheets.
It was my first time working with this group. This team is not buying the message. The group laughed. So much so, that three years ago, I founded a research company to focus on understanding supply chain excellence. I also believed that this company would have the best inventory and customer service. I was wrong.
With the purchase of i2 by JDA, and Logictools by IBM, manufacturing companies serious about network design started looking for a company, with a well-established community, that was more serious about network design. It could no longer be just about inventory levels. Instead, the design needed to be more encompassing.
High e-commerce shopping rates combined with construction delays are causing a strain in the supply of new warehouse space, especially as companies shift their inventory management strategies from just- in-time (JIT) inventory management to larger safety stocks for better responsiveness.
Most of the concepts were new to the team; and while the group had discussed many of the ideas at a high level, they had not been able to take the conceptual ideas into implementation. I asked the group to think of demand-driven concepts as the enabler of customer-centric strategies. As a result, there were arguments. Channel Sensing.
Most companies have made their own organizations more efficient (ROA), but they have not reduced inventories and they have pushed costs back in the supply chain on suppliers that are less able to bear them. We have let buy- and sell-side transactional relationships erode value. And, these are the best of their peer group.)
To drive global scale, companies need to design the supply chain to buy globally and execute locally. The company leverages globally sourcing strategies to buy products at a lower cost and then deploys some unique process logic to drive mass customization for retailers. Not many companies have cracked this code. Improvement.
Or mine supplier shifts to build alternate buying plans. Instead of relying on focus groups, we could learn through clicks/streams/ratings and reviews and apply the learnings continuously to markets. All are possible… However, to make the shift, we need to redefine work. Test and Learn.
Nine times out of ten, the finance group is portrayed as a dam, a barrier or a ferris wheel in the drawings. Companies tightly coupling the budget to S&OP have significantly higher inventories and lower growth than their peer group. Demand latency is two-eight weeks delayed from consumption purchase to translate to an order.
We organize all of the trending information in your field so you don't have to. Join 102,000+ users and stay up to date on the latest articles your peers are reading.
You know about us, now we want to get to know you!
Let's personalize your content
Let's get even more personalized
We recognize your account from another site in our network, please click 'Send Email' below to continue with verifying your account and setting a password.


Let's personalize your content