This site uses cookies to improve your experience. To help us insure we adhere to various privacy regulations, please select your country/region of residence. If you do not select a country, we will assume you are from the United States. Select your Cookie Settings or view our Privacy Policy and Terms of Use.
Cookie Settings
Cookies and similar technologies are used on this website for proper function of the website, for tracking performance analytics and for marketing purposes. We and some of our third-party providers may use cookie data for various purposes. Please review the cookie settings below and choose your preference.
Used for the proper function of the website
Used for monitoring website traffic and interactions
Cookie Settings
Cookies and similar technologies are used on this website for proper function of the website, for tracking performance analytics and for marketing purposes. We and some of our third-party providers may use cookie data for various purposes. Please review the cookie settings below and choose your preference.
Strictly Necessary: Used for the proper function of the website
Performance/Analytics: Used for monitoring website traffic and interactions
In today’s architectures and functional metrics, value optimization does not exist. And, when procurement and tactical planning operate in isolation, there is no decision support framework to guide the trade-offs especially when the functions are tethered to different and conflicting metrics. You are right.
In follow-up qualitative interviews, one of the largest issues with organizational alignment was metric definition and a clear definition of supply chain excellence. In my post Mea Culpa, I reference my work with the Gartner Supply Chain Hierarchy of Metrics. Error is error, but is it the most important metric? My answer is no.
Yawn and walk on if the answer is i mproving demand error or reducing inventory levels. On December 5th, Supply Chain Insights is hosting a small event at Georgia Tech to share the results of a two-year research effort to connect financial metrics by industry to supply chain performance to drive value.
Reason #6 Not effectively managing inventory. Reason #9 Relentless pursuit of one supply chain metric at the expense of other metrics. Yet, these are similar instructions as what is passed down to the supply chain from executives focused on a specific supply chain metric. There can be multiple reasons.
The Losers Are the Global Multi-National Supply Chain Teams As I work on the Supply Chains to Admire report, that will publish soon, I wince at the performance of large strategic customers of the supply chain planning vendors when compared to their peer groups. Today, companies measure too many metrics without a clear definition of value.
Despite the evolution of technology, none of the 28 industry segments I follow can drive improvement at the intersection of operating margin and inventory turns. Functional Metrics and the Lack of Alignment to Strategy. I define supply chain excellence as the ability to outperform an industry peer group during a time period.
But shippers looking to avoid disruptions and ensure that tight inventory levels don’t lead to missed sales opportunities pulled their orders forward. As companies look ahead to the next three to six months, they’re weighing costs, risks, and demand as they plan and adapt their inventory strategies.
Supply shortages resulting in empty shelves or parking lots of WIP inventory represent a spectre causing supply chain leaders to reconsider supply chain inventory practices. Opinion of just-in-time (JIT) as a practice has taken a battering and inventory is rising. Is supply chain inventory the problem?
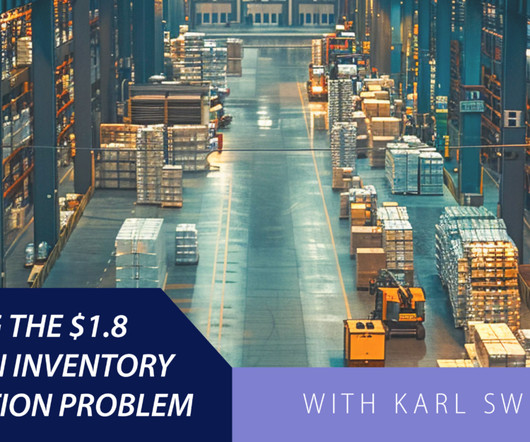
trillion distortion inventory problem. Trillion Inventory Distortion Problem In this podcast, Karl Swensen, CEO and Co-founder of Pull Logic, discusses how their AI-enabled technology helps retailers, brands, and manufacturers reduce lost sales by addressing supply chain and selling process failure points. Summary: Solving the $1.8
Picture this: You’re a warehouse manager, and with a few taps on your smartphone, you instantly know the exact location and quantity of every item in your inventory. That’s not science fiction—it’s the power of mobile inventory management. Ready to turn your inventory from a headache into a strategic asset?
The use of orbit charts allowed me to see the patterns of performance at the intersection of metrics over time. By charting the performance against peer groups, I could see the story. The first step was to find a reliable data set and establish the peer groups. The second step of establishing peer groups was trickier.
Only four percent of companies compared to their peer groups improved balance sheet performance of growth, operating margin, and inventory turns. When compared to pre-recession years, we ended the decade with twenty more days of inventory. Days of Inventory Comparison. Both companies outperformed their peer groups.
Over the last six years, we studied the connection between business results (growth, operating margin, inventory turns and Return on Invested Capital (ROIC)) and the link to company characteristics. The technology group wanted to implement SAP IBP, and the business leaders were resistant. Reward teams for cross-functional metrics.
For my long-time readers, you know that fewer than 3% of companies outperform their peer group in our Supply Chains to Admire analysis , and that the Gartner Top 25 is essentially a beauty contest for underperformers. The third step is to do a data inventory. The focus is on unveiling a new, bright, and shiny object. And what is value?
First, overreliance on a narrow group of suppliersespecially those in politically sensitive regionsexposes companies to risk when trade relationships shift. Companies that treat landed cost as a fixed figure are increasingly at risk of mispricing, misallocating inventory, or miscalculating profitability.
Use of Supply Chain Descriptors Most organizations are locked into functional silos driven by functional metrics. Stuck in a rut, supply chain leaders try to punch their way through a set of conflicting metrics and priorities each day. The metrics defining success in manufacturing and procurement do not align.
At each company, there is a relationship between the metrics of growth, margin, inventory, customer service, and asset strategy. For the purpose of this article, I will use Return on Invested Capital (ROIC) as the proxy metric to discuss asset utilization.) Understanding this relationship requires modeling. (A A Case Study.
They are unconscious that they are underperforming their peer group and have not driven industry improvement. An average margin of 21% with inventory turns of 1.58 Sanofi Performance Versus Peer Group for 2013-2022 Similarly, I find 35% of companies following the pack not able to drive resilience in the face of market shifts.
We talk about the move from functional metrics to a balanced scorecard, but we don’t use a balanced scorecard as an objective function. They underperform in their peer groups against companies weaker in planning. Orbit charts of four companies for the period of 2013-2022 at the intersection of operating margin and inventory turns.
As an analyst in the market for the past ten years (first with Gartner, then with AMR Research, followed by my work at Altimeter Group and now with my own firm Supply Chain Insights), I have stood in front of clients doing strategy days advocating “best practices” and I wanted to set the record straight. It was an awakening.
Using balance sheet data from 2011 to 2019, we chart companies’ progress by peer group on rate of improvement and performance in the metrics of growth, operating margin, inventory turns, and Return on Invested Capital (ROIC). A focus on functional metrics throws the supply chain out of balance.)
The Company was attempting to gain economies of scale by grouping manufacturing technologies within a common infrastructure to reap the benefits of a co-generation facility, a centralized warehouse, and a talented administrative team. In my forty years of studying supply chain planning, the groups became larger, but with questionable results.
It is the end of a two-year research project, and identifies which publicly held companies outperformed their peer group on balance sheet results. We built peer groups based on like industries. How did you define peer groups? As a result, we report their results along with their pharmaceutical peer group.
My client attempted to have a supply chain discussion to improve flow, and his executive group just did not get it. In the early 1980s, As a result, we did not have a perpetual inventory signal. Without a perpetual inventory signal, we were never synchronized on where to place customer orders. The metrics were not aligned.
The research tries to establish “ who did supply chain best ” by looking at a weighted formula of Year-over-Year Growth, Return on Assets (ROA), and Inventory Turns for the Fortune 500 companies. Inventory Turns values are based on an average of quarterly reporting for the past year. Inventory Turns is only part of the story.
The idea is that data points within a group share similar properties, and each group is different (statistically speaking) from another. Retailers can apply cluster analysis techniques in different ways to find groups of customers, products, stores, or suppliers that behave similarly. The retail industry is rich with data.
Groupthink is a psychological phenomenon that occurs within a group of people in which there is a desire for harmony within the group, but the result is an irrational or dysfunctional outcome. I feel that the industry is engaged in ‘Group Think’ No one in this meetings is going to ask tough questions.
These steps include sourcing and receiving inventory, storing inventory, order processing, picking and packing an order, shipping the order, and returns management. Factors like planning tools, inventory management, demand patterns, and innovations in technology contribute to the success or failure of fulfillment optimization.
It is now our fifth year of analyzing balance sheets to understand which companies are outperforming their peer groups on the metrics of growth, operating margin, inventory turns and Return on Invested Capital (ROIC) while driving improvement. This is the fun part of my job. This work is not easy. Today, it is not.
The future inventory fire sale. One of my stark realizations this year is that smaller companies are beating larger and often more established companies on growth metrics, inventory turns, operating margin, and Return on Invested Capital (ROIC). (In The metrics selection resulted from work with Arizona State University in 2013.)
The award, based on beating the industry peer group on rate of improvement on the key metrics of growth, operating margin, inventory turns, and Return on Invested Capital (ROIC) while outperforming their peer group, is tough to achieve. Orbit Chart for L’Oréal at the Intersection of Inventory Turns and Operating Margin.
Tom, the colorful warehouse manager, constantly heckled Frank for the increasing inventory levels while Ed, the quiet material/logistics manager, constantly questioned if there was a better way. He felt that inventory was no problem, he would just cut it at the end of each quarter to make the balance sheet goals. The So What?
The obvious danger of this is that business rules and data governance often don’t exist from department to department or user to user, leaving an overall picture into the health of the business that is foggy because KPIs and metrics do not correlate across the organization. A great example of this comes from a Logility customer.
I also continued to work on the manuscript for the book Metrics That Matter to publish in the fall of 2014. This is a networking group that meets by phone once a month. The average client that has implemented demand sensing technologies has reduced inventory by 11%. The book is now a very worn manuscript. It makes a difference.
Think about it: How much time is wasted hunting down misplaced inventory? These include: Barcode Scanning Devices: These handheld devices, equipped with integrated inventory management apps, enable real-time tracking and data entry. Think real-time inventory visibility across all your locations.
When new groups come together, the forming process is often awkward. ” In this team activity, people who do not know each other list four statements and ask the group to guess which statement is false. .” ” I played three lies and a truth with the group. Here they are: The Lie of Inventory Reduction.
When compared to the peer group performance, smaller and regional players outperform larger companies. Intuitive Surgical, L’Oreal, and Sleep Number drove excellence through product and service innovation to outperform their peer groups. The supply chain has two important buffers–inventory and capacity.
For the supply chain team, the largest area of misalignment is between the supply chain and the sales group. Supply teams are being pressured to reduce costs while demand groups are feeling the squeeze to get the “ demand plan right.” Next week, I will be writing on my new book Metrics That Matter.
It is not as simple as trading-off inventory, cost, and customer service. In the Supply Chains to Admire analysis, the focus is to understand the relative performance of a company within a peer group of growth, operating margin, inventory turns, and Return on Invested Capital (ROIC). This share group is now in its sixth year.
I have taken myself off the road to write the book Metrics That Matter. On the 2nd of April, I sat before a board discussing how a company could exceed expectations in the delivery of Return on Invested Capital (ROIC) and superior operating margins and fail at the delivery of customer service and inventory. It is a slow week.
The impact of complexity on inventory is not quick. To help, today I want to share some of the insights from our recent Inventory Optimization study. Inventory management is a hot issue. Companies invest in project after project, yet inventory levels remain the same. The Business Problem. The analogy is weight loss.
This report, Supply Chains to Admire , compares the progress of 200 companies within their respective peer groups on both performance and improvement. Aligned Metrics. Do you actively design networks with a focus on form and function of inventory? Supply Chain Design. Active, and intentional, design of the supply chain.
I just don’t think the comparison of very different industries in a spreadsheet based on growth, inventory values, and Return on Assets (ROA) is meaningful. To be valid, I believe that companies must be compared within a peer group. As a result, the metrics have to be viewed together as a pattern over time.
An efficient supply chain strategy is one that takes every aspect of your supply chain into account, from inventory management and warehouse design to freight tendering and transport optimisation. Inventory Management The key starting point is implementing proper ABC analysis, and you need to look at it from multiple angles.
We organize all of the trending information in your field so you don't have to. Join 102,000+ users and stay up to date on the latest articles your peers are reading.
You know about us, now we want to get to know you!
Let's personalize your content
Let's get even more personalized
We recognize your account from another site in our network, please click 'Send Email' below to continue with verifying your account and setting a password.


Let's personalize your content