This site uses cookies to improve your experience. To help us insure we adhere to various privacy regulations, please select your country/region of residence. If you do not select a country, we will assume you are from the United States. Select your Cookie Settings or view our Privacy Policy and Terms of Use.
Cookie Settings
Cookies and similar technologies are used on this website for proper function of the website, for tracking performance analytics and for marketing purposes. We and some of our third-party providers may use cookie data for various purposes. Please review the cookie settings below and choose your preference.
Used for the proper function of the website
Used for monitoring website traffic and interactions
Cookie Settings
Cookies and similar technologies are used on this website for proper function of the website, for tracking performance analytics and for marketing purposes. We and some of our third-party providers may use cookie data for various purposes. Please review the cookie settings below and choose your preference.
Strictly Necessary: Used for the proper function of the website
Performance/Analytics: Used for monitoring website traffic and interactions
For example, if I improve the cost structure in transportation, procurement, manufacturing and sales independently, what decision support framework decides the right trade-offs? In today’s architectures and functional metrics, value optimization does not exist. You are right. The answer is not th e Gartner Top 25.
Once upon a time, the world of manufacturing was a relatively stable place. Suddenly, managing inventory is the name of the game for companies trying to manage working capital and maximize profit while keeping customers happy. So how does a manufacturer navigate this rollercoaster?
Solvoyo has a metric they call the user acceptance rate. This metric measures the percentage of time the planners accept replenishment, transportation, or inventory plans as they are without any change in the timing of the delivery or the quantity to be delivered. You don’t act on a forecast; you act on what you purchase.
Procurement and supply chain management are often used interchangeably—but in practice, the lines between them can blur in ways that create real friction. Misaligned priorities, siloed systems, and unclear ownership can directly impact key performance indicators like cost savings percentage and procurement cycle time.
Reducing cost was the primary objective, and most operational decisionsfrom sourcing to fulfillmentreflected that mindset. Sudden tariff increases can quickly make a cost-optimized procurement strategy untenable, leaving companies scrambling to adjust. Procurement is another area seeing change.
Despite the evolution of technology, none of the 28 industry segments I follow can drive improvement at the intersection of operating margin and inventory turns. Functional Metrics and the Lack of Alignment to Strategy. Change is Hard. Unlearning is Tougher. The industry is full of experts. Guess what? The Lovefest with Shiny Objects.
Transportation, warehousing, and manufacturing collectively contribute significantly to carbon emissions, making these areas critical for meaningful change. Ethical sourcing is a fundamental aspect of social sustainability. The impact of supply chains on local communities cannot be overlooked.
If you would like to participate in a current research study, we would love your help and participation in the contract manufacturing study. We are trying to assess the value of a network in managing contract manufacturing.) One of the alignment gaps that is growing and is unfortunate is the gap between procurement and manufacturing.
Most of the business networks were hollowed out by venture capitalists or purchased by opportunists. Yawn and walk on if the answer is i mproving demand error or reducing inventory levels. At the session, we will discuss the choice of metrics for a balanced scorecard to improve market capitalization/employee by industry.
Scaling manufacturing operations is crucial for business growth but presents unique challenges. Balancing increased demand with consistent quality and controlled costs is difficult but essential for manufacturers looking to expand. Successfully scaling manufacturing requires more than just adding resources.
Optimizing fulfillment requires a series of steps to get a shipment from its source to the end customer. These steps include sourcing and receiving inventory, storing inventory, order processing, picking and packing an order, shipping the order, and returns management.
It is crucial for organizations to understand the importance of Purchase Order collaboration to effectively manage their direct spend, optimize operations, and mitigate risks. Make to Order: Here, products are manufactured based on specific customer orders.
At each company, there is a relationship between the metrics of growth, margin, inventory, customer service, and asset strategy. For the purpose of this article, I will use Return on Invested Capital (ROIC) as the proxy metric to discuss asset utilization.) Supply chain excellence was largely defined as manufacturing excellence.
In today’s dynamic market, procurement is far more than just a buying and purchasing center. Forward-thinking organizations have transformed the department into an untapped gold mine that creates value for the entire end-to-end manufacturing process—from design and sourcing to production and delivery.
By maximizing space utilization, improving inventory control , and boosting workflow efficiency, you can unlock significant cost savings and elevate your customer service game. Essential technology solutions, including Warehouse Management Systems (WMS), Inventory Management Systems (IMS), and the transformative power of IoT and automation.
The issue is that when companies optimize functional metrics, they throw the supply chain out of balance and sub-optimize value. We have not designed the planning systems to serve managers, directors, and vice presidents, aiming to improve decision-making and collaboration across the source, make, and deliver processes.
That’s the power of manufacturing data collection. Manufacturing data collection is your secret weapon for boosting efficiency, cutting waste, and staying ahead of the competition. Manufacturing data collection is your secret weapon for boosting efficiency, cutting waste, and staying ahead of the competition.
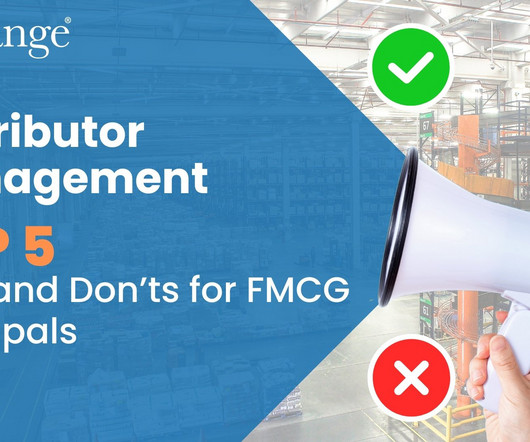
Do Set Clear KPIs and Governance Structures : Establish transparent metrics for sales, coverage, and service levels. Do Embrace Technology and Data : Use real-time data for demand forecasting, inventory management, and route optimization. A well-equipped distributor is an extension of your brand and a key to market penetration.
If you’re evaluating procurement technology or exploring ways to drive more value from existing systems, chances are you’re looking beyond tactical fixes – you want a smarter, scalable strategy. Misaligned priorities across finance, legal, and procurement create friction that delays decision-making and reduces impact.
Supply chain efficiency is the cornerstone of success and involves the effective management of processes, resources, and technologies from procurement to production, transportation to warehousing. In the automotive sector, manufacturers are simultaneously reducing inventory costs and delivery times.
Keeping track of all your moving parts in manufacturing is a tall order. That’s where manufacturinginventory management software comes in. We’re talking real-time tracking, automated purchasing, and a whole lot less stress. Spreadsheets just don’t cut it anymore.
GEP and the North Carolina State University (NCSU) Supply Chain Resource Cooperative surveyed supply chain, procurement and IT professionals across a range of industries to gain insight into their priorities and strategies regarding supply chain resilience and optimization. Procurement solutions are often updated with purchased information.
The research methodology for the Supply Chains to Admire compares the performance of a company against its industry peer group for the metrics of Year-over-Year Revenue Growth, Inventory Turns, Operating Margin, and Return on Capital Employed (ROCE). Today, companies measure too many metrics without a clear definition of value.
Only four percent of companies compared to their peer groups improved balance sheet performance of growth, operating margin, and inventory turns. When compared to pre-recession years, we ended the decade with twenty more days of inventory. Days of Inventory Comparison. The first story is about a large regional food manufacturer.
Supplier Collaboration: Fundamental to Elevating Manufacturing Performance Supplier relationships are at the heart of manufacturing performance. That’s why supplier collaboration—that consistent, trusted, and responsive interaction between supplier and manufacturer—is pivotal to manufacturing success.
Optimization engines to improve functional metric performance resulted in an exploding number of planners. Rolling up a perpetual inventory signal takes eleven hours. Contract Manufacturing Signal Latency. In my last blog post, I shared insights on data synchronization between brand owners and contract manufacturing.
While the performance rankings were based on comparisons of inventory turns, operating margin and Return on Invested Capital (ROIC) for the periods of 2006-2013 and 2009-2013, the concept is that to be a supply chain leader you must outperform and drive improvement. Aligned Metrics. Can you help us with what you see in the data?”
Over the last six years, we studied the connection between business results (growth, operating margin, inventory turns and Return on Invested Capital (ROIC)) and the link to company characteristics. Reward teams for cross-functional metrics. Focus functional metrics to improving reliability. What did we find?
Frank, the line manager for manufacturing, dominated the meetings. Tom, the colorful warehouse manager, constantly heckled Frank for the increasing inventory levels while Ed, the quiet material/logistics manager, constantly questioned if there was a better way. The second step is to align metrics to the strategy.
Picture this: You’re a warehouse manager, and with a few taps on your smartphone, you instantly know the exact location and quantity of every item in your inventory. That’s not science fiction—it’s the power of mobile inventory management. Ready to turn your inventory from a headache into a strategic asset?
In the fast-paced world of smart manufacturing, making quick, accurate and informed decisions is essential. Real-time decision-making, powered by artificial intelligence (AI) , is revolutionizing smart manufacturing processes. That said, manufacturers need to take several steps to successfully enable these technologies.
The team was organized around the functional silos of source, make and deliver. Proudly, I had led my division to have the lowest manufacturing costs with the highest Return on Assets. I also believed that this company would have the best inventory and customer service. It had been this way for over two decades. I was wrong.
It’s the key to transforming your supply chain from a source of frustration into a well-oiled, profit-generating machine. Data analytics also offers actionable insights for: Inventory Management: See stock levels across multiple locations in real-time. That’s where data analytics comes in.
When we think about the critical requirements for a manufacturer to succeed, productivity, quality, and inventory management immediately jump to mind. But another factor can play an equally strong role in making or breaking a manufacturing business: communication. Design-Through-Manufacturing Efficiencies.
Inventory is the lifeblood of any manufacturing business. By leveraging analytics and key performance indicators (KPIs), manufacturers can optimize inventory, reduce waste, and boost profitability. Tracking inventory flow and performance across your supply chain is a must. But what exactly should you measure?
During the 1980s, I was on a management team for a large manufacturer. The Company was attempting to gain economies of scale by grouping manufacturing technologies within a common infrastructure to reap the benefits of a co-generation facility, a centralized warehouse, and a talented administrative team. Lack of aligned metrics.
Despite two decades of advancement in supply chain technologies, companies are struggling to gain balance at the intersection of operating margin, inventory turns and case fulfillment. I have learned that supply chain systems are more complex than I originally thought, and that the relationships between supply chain metrics are nonlinear.
At that time, manufacturers talked about customer-centric supply chains, but were afraid to aggressively adopt ecommerce strategies. Manufacturers, today, are aggressively pursuing e-commerce strategies. Get Good at Having a Real-time Perpetual Inventory Signal. No matter where inventory is, put it to work. Redefine it.
We’ve already listed the top 10 manufacturing blog posts and the top 10 supply chain blog posts last week. When a manufacturer’s product normally moves through the supply chain network, it is to reach the distributor or customer. Any process or management after the sale of the product involves reverse logistics.
Commerce is global and regional at the same time, the world is getting smaller and more interconnected, and Consumer Packaged Goods (CPG) manufacturers operate in this build-anywhere and sell-anywhere market. Here we have compiled a list of the top six challenges that CPG companies face in the post-pandemic market.
Tomorrow, I have a call with a manufacturing company to answer the question, “ What is the most important concept in the book?” While Joe is trying to balance the feedback from Filipe and Frank, he is often asked to change his metric targets by his CFO named Lou. Achieving Balance in Metrics. I have three.
Sustainable manufacturing has become essential for manufacturers to maintain customer loyalty, win new business, and remain competitive in today’s supply chain based marketplace. In the past, manufacturers were slow to set goals in this area. Sustainable manufacturing also enhances employee, community, and product safety.”
“The idea of the value chain is based on the process view of organizations, the idea of seeing a manufacturing (or service) organisation as a system, made up of subsystems each with inputs, transformation processes and outputs. ” Institute for Manufacturing, 2013. __. E2open last week announced the purchase of Serus.
The award, based on beating the industry peer group on rate of improvement on the key metrics of growth, operating margin, inventory turns, and Return on Invested Capital (ROIC) while outperforming their peer group, is tough to achieve. Based in Paris, L’Oréal is a global personal care manufacturing company.
We organize all of the trending information in your field so you don't have to. Join 102,000+ users and stay up to date on the latest articles your peers are reading.
You know about us, now we want to get to know you!
Let's personalize your content
Let's get even more personalized
We recognize your account from another site in our network, please click 'Send Email' below to continue with verifying your account and setting a password.


Let's personalize your content