This site uses cookies to improve your experience. To help us insure we adhere to various privacy regulations, please select your country/region of residence. If you do not select a country, we will assume you are from the United States. Select your Cookie Settings or view our Privacy Policy and Terms of Use.
Cookie Settings
Cookies and similar technologies are used on this website for proper function of the website, for tracking performance analytics and for marketing purposes. We and some of our third-party providers may use cookie data for various purposes. Please review the cookie settings below and choose your preference.
Used for the proper function of the website
Used for monitoring website traffic and interactions
Cookie Settings
Cookies and similar technologies are used on this website for proper function of the website, for tracking performance analytics and for marketing purposes. We and some of our third-party providers may use cookie data for various purposes. Please review the cookie settings below and choose your preference.
Strictly Necessary: Used for the proper function of the website
Performance/Analytics: Used for monitoring website traffic and interactions
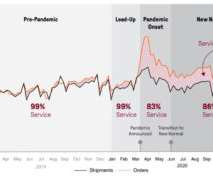
If you would like to participate in a current research study, we would love your help and participation in the contract manufacturingstudy. We are trying to assess the value of a network in managing contract manufacturing.) The metrics defining success in manufacturing and procurement do not align.
The award, based on beating the industry peer group on rate of improvement on the key metrics of growth, operating margin, inventory turns, and Return on Invested Capital (ROIC) while outperforming their peer group, is tough to achieve. Based in Paris, L’Oréal is a global personal care manufacturing company.
Over the years, working for and with numerous manufacturing companies, I’ve seen many supply chain practices that cost companies money. Reason #9 Relentless pursuit of one supply chain metric at the expense of other metrics. Social studies? Why do companies focus on reducing a specific metric? by John Westerveld.
Case Studies. A Case Study. This case study will show you the analysis of Apple Supply Chain core processes, challenging issues and complexities of its operations. Information about Apple Supply Chain is a bit here, there and everywhere, its kinda tough to find the actual case study. Is Apple Supply Chain Really the No.
In the recent study of the Voice of the Supply Chain Leader , we find that the gaps are large, and growing. One of my favorite interviews on this topic, that I recently completed for my upcoming book Metrics That Matter , was with Amway’s Chief Supply Chain Officer George Calvert. Service level is our most important metric.
Analysis of case study is certainly one of the most popular methods for people from business management background. In order to accelerate the learning, this article has gathered 20+ most sought-after supply chain case studies, analyzed/categorized them by industry and the findings are presented.
After two decades of study, I think because it is a lack of understanding. At each company, there is a relationship between the metrics of growth, margin, inventory, customer service, and asset strategy. For the purpose of this article, I will use Return on Invested Capital (ROIC) as the proxy metric to discuss asset utilization.)
Today, we kick off our annual year end series highlighting the top blog posts in each of our 7 main categories: Manufacturing , Supply Chain , Logistics , 3PL , Business , Transportation , Freight. Top Manufacturing Blog Posts for 2014. Finally, the top 10 list was rounded out safety and metrics. Read Full Post. Read Full Post.
We have found that supply chain metrics are gnarly and complicated.During In our program, cost avoidance, while desirable, does not count towards the metric. Our approach simply breaks accountabilities and goals across the areas of Manufacturing, Logistics/Network Optimization and Ingredients/Packaging. What have you learned?
Much has been done to improve manufacturing efficiency. As the common linchpin that brings together all manufacturing activities, has this metric improved along with all the investment in new technologies? As a result, this metric is often downplayed or not referenced in the discussion.
The issue is that when companies optimize functional metrics, they throw the supply chain out of balance and sub-optimize value. There is no unifying data model to align procurement and manufacturing, transportation and distribution, revenue management and demand planning, or sales account teams with supply chain planning.
But, I want to understand this more, and as a result, I have a new study in the field to gain additional insights, and I would love your input. In 2012, I placed the first alignment study in the field. Functional Metrics. To respond, follow this link. To entice you to participate let’s look at the data more closely.
For organizations layered in functional metrics and driving a cost agenda, this is a tough nut to crack. Currently, I am working on a study to understand the value of synchronizing contract manufacturing with in-house manufacturing and procurement. Tougher than most understand. This is what we are trying to assess.
Over the last six years, we studied the connection between business results (growth, operating margin, inventory turns and Return on Invested Capital (ROIC)) and the link to company characteristics. Reward teams for cross-functional metrics. Focus functional metrics to improving reliability. What did we find?
A study by E2open – the 2021 Forecasting and Inventory Benchmark Study: Supply Chain Performance During the Covid-19 Pandemic – provides the answers. I look forward to this study every year. The study shows delivering good service to grocery chains has never been harder. Forecasting Accuracy Was Terrible .
Two recently published studies identify the top disruptions that impacted industry, business and global supply chains during 2024 and our expected to be present in 2025. Within the report, each risk is assigned a risk score metric to help global supply chain leaders prioritize planning and mitigation efforts this year.
I am currently working on a couple of case studies for this blog on how business leaders used digital twin modeling during the pandemic. Advanced planning evolved with a focus on modeling manufacturing constraints. Watermelon Metrics Don’t Drive The Right Results. I love the metaphor of watermelon metrics.
ARC has been actively studying industrial AI for over two years. Ibrahim Al Syed, the director of digital manufacturing at Celanese, was surprisingly forthcoming about how Celanese developed these capabilities at ARC Advisory Groups 29th Annual ARC Industry Leadership Forum. The company has 55 manufacturing sites across the world.
Frank, the line manager for manufacturing, dominated the meetings. Despite goals to improve agility and resiliency, functional metrics for manufacturing efficiency continually throw the supply chain out of balance. Strong manufacturing organizations do not make the most effective manufacturers.
In this final blog on agility and why you should consider becoming an agilist to survive the new completion (of the continuous mention) of the application of enterprise decision management systems (EDMS) from Taylor and Raden cited in the first blog, I turn to the metric of agility and a new ROI metric of decision yield.
In research study after study, we see that the greatest challenge to achieving supply chain excellence is the understanding of the supply chain by the leadership team. Closing the gaps happens when there are aligned metrics, clarity of vision and aligned planning processes. Metrics Alignment. They lack cohesion.
Manufacturers have always struggled to know their customers. Unfortunately, this means manufacturers face an even greater challenge, as more customers translate into greater use of customer service. But, how do manufacturers turn their focus to the customer experience? Determine What Customers Want Today.
“I study supply chains. In our work, we tie research from quantitative and qualitative studies to financial results to drive new insights. Proudly, I had led my division to have the lowest manufacturing costs with the highest Return on Assets. .” I walked to the center of the stage, looked stage left and continued.
I have learned that supply chain systems are more complex than I originally thought, and that the relationships between supply chain metrics are nonlinear. Along the way, I will be doing more work on network design case studies. The greatest gap is in the design of supplier and manufacturing networks. Where Would I Start?
Both companies provide packaging materials to the food manufacturing industry. Food manufacturers, over the course of the last decade, have pushed costs and waste backwards in the supply chain. billion company, manufactures glass containers with headquarters in the Midwest. It cannot be about singular metrics.
In manufacturing-based companies, 70-80% of costs are in the processes of source, make and deliver. In a recent study, our goal was to understand the impact of process and technology choices on balance sheet performance. We analyzed the impact of 150 factors on 493 financial metrics for the period of 2004-2016. Talent Gaps.
While many employers would have penalized the employees for tablet breakage , Peggy explored the world of wearables to enable her digital manufacturing transformation. AGCO’s culture of innovation policy deployment enabled employees to pioneer a technology solution for manufacturing. Improvement in Digital Manufacturing.
During the 1980s, I was on a management team for a large manufacturer. The Company was attempting to gain economies of scale by grouping manufacturing technologies within a common infrastructure to reap the benefits of a co-generation facility, a centralized warehouse, and a talented administrative team. Lack of aligned metrics.
For the past five years, the team at Supply Chain Insights identified Supply Chains to Admire Award Winners by analyzing performance by peer group on the key metrics of growth, operating margin, inventory turns and Return on Invested Capital (ROIC). At Rockwell this includes all processes end-to-end except for manufacturing.
I can recall a case study when I was in business school where a profitable, fast-growing manufacturer nonetheless went out of business. The Rule of 40 was popularized by venture capitalists in recent years as a key performance metric for SaaS firms. on this metric. The Rule of 40. The problem? GAAP versus Non-GAAP.
Much has been done to improve manufacturing efficiency. As the common linchpin that brings together all manufacturing activities, has this metric improved along with all the investment in new technologies? As a result, this metric is often downplayed or not referenced in the discussion.
To understand supply chain excellence, Abby and I have been studying pattern recognition for industry peer groups at the intersection of the metrics in the Supply Chain Effective Frontier of growth, profitability, cycles and complexity. This month we are also completing three studies. This analysis has been fun and insightful.
It was funded by 50 large consumer products manufacturing companies (CPG). In the dawn of e-commerce, conservative manufacturers, anteed up $240 million in four months. the company is owned today by 20 organizations representing manufacturers, distributors, hospitals and group purchasing organizations (GPOs).
I now have a working manuscript for the entire book of Metrics That Matter. Today, based on our studies, women compose about 43% of the supply chain workforce. In preparation, we are finishing up research on supply chain planning excellence, big data and supply chain, supply chain talent, and digital manufacturing.
Case Studies. Would you like to understand supply chain management concept but dont have time to study from a supply chain textbook ? For example, if you were a contract manufacturer in China, you might already have different logistics networks for different customers. 7) Adopt Both Service and Financial Metrics.
Contract manufacturing or 3PL data often will have a 24-hour latency due to batch integration. When they built the project, they did not realize that they did not have access to daily data daily for their third-party warehouses and contract manufacturing locations. Figure 4 is a case study from Lenovo. 2) Latency. Master data.
As a result, the metrics have to be viewed together as a pattern over time. In the journey, the supply chain leader needs to improve the potential of a portfolio of metrics. The metrics of growth, Return on Invested Capital, Inventory Turns and Operating Margin have the highest correlation to market capitalization.
“The idea of the value chain is based on the process view of organizations, the idea of seeing a manufacturing (or service) organisation as a system, made up of subsystems each with inputs, transformation processes and outputs. ” Institute for Manufacturing, 2013. __. Tipping points are fascinating to watch.
We speak about the need to move from a functional understanding to a global, holistic capabilities, but the traditional supply chain leader defines bonus incentives and process performance goals based on functional metrics. Measurement. Organizations speak of the bullwhip, but don’t measure it or monitor the effects. Innovation.
Karl is the CEO and Co-founder of Pull Logic , an AI-enabled tech company focused on reducing lost sales for retailers, brands, and manufacturers due failure points in the supply chain and selling processes. Summary: Solving the $1.8 Key Takeaways: Solving the $1.8 Timestamps (00:00:00) Solving the $1.8T Timestamps (00:00:00) Solving the $1.8T
In the annual report where they report on their key performance indicators (KPIs), they don’t just report on core financial metrics and the NPS, they also have people metrics. The company has shown sustained improvement on this metric. Ferguson does 20 to 30 studies a year using this tool. The company recorded 1.9
By fostering collaboration across all stakeholders, including suppliers, manufacturers, and logistics providers, companies can enhance visibility, streamline processes, and proactively address disruptions. Make to Order: Here, products are manufactured based on specific customer orders.
September 26, 2019) A new study by ToolsGroup, a global leader in supply chain planning software, and Spinnaker, a supply chain services company, has found that only 7% of companies are reaping the benefits of digital transformation of supply chain planning. BOSTON, Mass. and HOUSTON, Tex.
The average manufacturing company’s supply chain organization is 15 years old. The supply chain is a complex system with finite, and non-linear relationships between supply chain metrics that drive balance sheet results. We find that companies can improve one, but not two of the metrics. A Look at History. Resiliency.
We organize all of the trending information in your field so you don't have to. Join 102,000+ users and stay up to date on the latest articles your peers are reading.
You know about us, now we want to get to know you!
Let's personalize your content
Let's get even more personalized
We recognize your account from another site in our network, please click 'Send Email' below to continue with verifying your account and setting a password.
Let's personalize your content