This site uses cookies to improve your experience. To help us insure we adhere to various privacy regulations, please select your country/region of residence. If you do not select a country, we will assume you are from the United States. Select your Cookie Settings or view our Privacy Policy and Terms of Use.
Cookie Settings
Cookies and similar technologies are used on this website for proper function of the website, for tracking performance analytics and for marketing purposes. We and some of our third-party providers may use cookie data for various purposes. Please review the cookie settings below and choose your preference.
Used for the proper function of the website
Used for monitoring website traffic and interactions
Cookie Settings
Cookies and similar technologies are used on this website for proper function of the website, for tracking performance analytics and for marketing purposes. We and some of our third-party providers may use cookie data for various purposes. Please review the cookie settings below and choose your preference.
Strictly Necessary: Used for the proper function of the website
Performance/Analytics: Used for monitoring website traffic and interactions
Managing transportation — the ebb and flow of rates, capacity, fuel and regulations — is an ongoing challenge for many companies, especially those still using spreadsheets and fax machines to plan and execute shipments. How will you establish and manage electronic communication with carriers and other trading partners?
We consistently see that companies focused on functional excellence–a focus within a functional silo like manufacturing, transportation or distribution– or singular metrics– like inventory or costs– underperform against their peer groups. Reward teams for cross-functional metrics. NetworkDesign Analysis.
I have learned that supply chain systems are more complex than I originally thought, and that the relationships between supply chain metrics are nonlinear. In my work on the Supply Chain Index , I see that companies I recognize as doing networkdesign well are rising faster on the list of the Supply Chain Index work.
For logistics professionals, this translates to smarter warehouse layouts, more accurate transportation planning, proactive maintenance scheduling, and a new level of resilience through cost-to-serve optimization. This article explores how digital twins are being deployed in transportation, warehousing, and networkdesign.
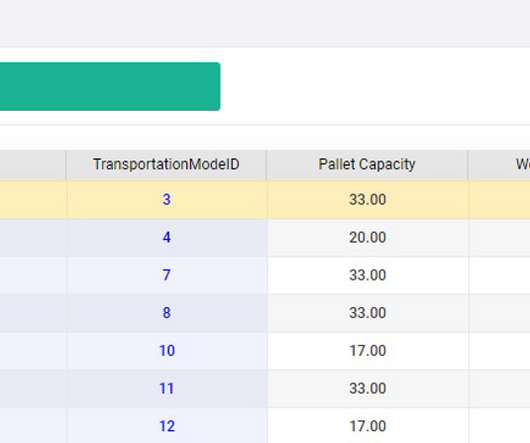
This configuration screen shows how Solvyouo maps transportation constraints. A networkdesign model figures out where factories and warehouses should be located. Here the savings are based on transportation and facility cost savings. The key solution for this is networkdesign.
Yes, we have achieved greater normalcy in transportation. For organizations layered in functional metrics and driving a cost agenda, this is a tough nut to crack. I don’t care what you call it, but networkdesign, what-if analysis, simulation and digital twin approaches grow in importance.) What is normalcy?
Forget static networkdesigns and gut-feel decisions. By harnessing the power of data science and analytics, you can gain end-to-end visibility across your entire network, breaking down information silos and optimizing every stage of your operations. That’s where data analytics comes in.
This week, I will speak at Llamasoft’s conference on improving supply chain networkdesign. While innovation has slowed in Enterprise Resource Plannning (ERP) and Supply Chain Planning, I am bullish about some of the innovation coming from the supply chain networkdesign technology providers like JDA, Llamasoft and Solvoyo.
Integration of corporate social responsibility metrics in planning. Supply Chain Design. Ad hoc design planning often focused on a function of the supply chain. Most often the focus is on transportation or logistics, but does not take into consideration the trade-offs between make, source and deliver.
We Assumed that Transportation Would Always Be Available And That We Just Needed to Negotiate Price. Over the past decade payments to transportation carriers from shippers increased from net 30 to net 60 moving to net 90 in 2019. Each requires design and fine tuning.
This of course generates carbon from transportation activities. In the early 2020s, Microsoft’s transportation and logistics team needed to meet growing demand for cloud services while managing carbon, cost and cycle time. Microsoft’s transportation is outsourced to carrier partners.
An efficient supply chain strategy is one that takes every aspect of your supply chain into account, from inventory management and warehouse design to freight tendering and transport optimisation. Transport Fleet Optimization Fleet optimisation is one of those areas where companies leave money on the table.
The low Return on Invested Capital (ROIC) and the growth below the industry average comes from the lack of networkdesign and organizational alignment between new product development, manufacturing, and procurement. During the pandemic, transportation costs skyrocketed, creating increasing tension between customer service and price.
I did not understand warehousing and transportation until reassignment to a logistics role in 1985. Slowly, as shown in the image of the consumer value network, supply chain leaders expand the scope of their supply chain operations from the customer’s customer to the supplier’s supplier with a clear view on the customer.
Our ability to do this has gotten better because real-time transportation visibility solutions give the warehouse much better certainty surrounding when a truck will arrive at the DC. Flowthrough needs planning that spans across both warehouse and transportation management systems. Networkdesign is used for this.
In the annual report where they report on their key performance indicators (KPIs), they don’t just report on core financial metrics and the NPS, they also have people metrics. The company has shown sustained improvement on this metric. The company was designated an essential business that needed to stay open.
The combination of technology along with the advancements in transportation made it possible. The winners drive improvement while posting financial results in the Supply Chain Metrics That Matter ahead of the peer group. A Supply Chain Leader will make progress on both of these key metrics with a very tight and controlled pattern.
For shippers, culture and behavior have to change to apply Lean Transportation thinking. The “Them (company leadership) versus Us (shop floor associates)” mentality also needs to change for Lean Transportation to " WE. The 8 Rights To Achieve Lean Transportation Practices. Transportation takes time.
Warehouse Management and Transportation Management were in their infancy. I think that supply chain design is at the center of a great supply chain, and the best processes are deliberate and intentional. It should not be functional, with a narrow focus on a singular function like manufacturing or transportation.
Note to the reader: we selected these metrics for the balanced scorecard for the analysis after work with Arizona State University to understand which metrics, in combination, most closely correlated with market capitalization. Think about physical networkdesign. Most companies do not actively design flows.)
DB Schenker’s strong network of multimodal solutions also helped mitigate the impacts of black swan events like the incident at the Suez Canal. Overland transport solutions from Singapore all the way to China & even Europe were also executed to executed to keep supply chains moving. DB SCHENKER Schenker Singapore (Pte) Ltd.
In the survey, APQC used a series of performance metrics, including net promoter score, customer retention rate, perfect order performance, and on-time delivery among others, to identify the top performing companies. Below are the results from the cross-industry report for environmental sustainability.
There are many forms of decision support—price optimization, revenue management, transportation planning, spend management, networkdesign. The design principle is that history is a good predictor of the future. An orbit chart is a plotting of data at the intersection of two metrics.
Granular data by volume is a must to be able to manage replenishment, networkdesign, and inventory targets. No metric should be measured in isolation, and functional metrics should be replaced with the balanced scorecard metrics shown in Figure 2. The issues include: Level of granularity. Time horizon.
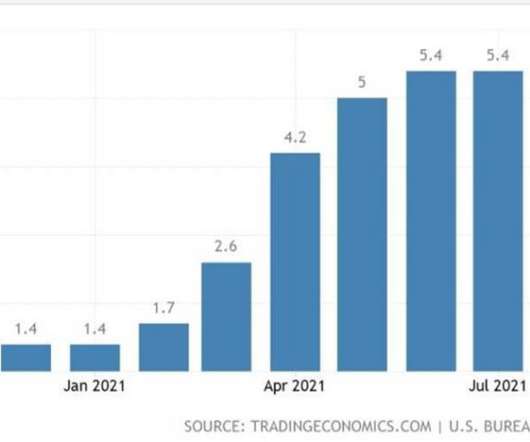
Continuing Disruptions in Transportation and Sourcing Materials After the pandemic, retailers are faced with new challenges and disruptions due to global conflicts, trade restrictions, and now recessions. Here are some highlights from these trends in 2023 and implications on supply chain planning. in 2021 compared to the year before.
The advent of transportation management systems (TMS) in the 1990s introduced near-infinite metrics and data points into the supply chain yet brought with it more questions than answers: How do we centralize the data? How well is my transportation routing guide performance? How do we analyze it efficiently? Cost Savings.
We Assumed that Transportation Would Always Be Available And That We Just Needed to Negotiate Price. Over the past decade payments to transportation carriers from shippers increased from net 30 to net 60 moving to net 90 in 2019. Each requires design and fine tuning.
We Assumed that Transportation Would Always Be Available And That We Just Needed to Negotiate Price. Over the past decade payments to transportation carriers from shippers increased from net 30 to net 60 moving to net 90 in 2019. Each requires design and fine tuning.
The best way to start the design of an agile supply chain is to look at the sources of variability and market volatility that your supply chain encountered in the prior year. These can be shift in the channel, issues in manufacturing, increasing variability in transportation, or a shift in commodity prices.
Change internal metrics to a balanced scorecard and force the functions to work better together. Labor turnover, supply reliability, and transportation variation are here to stay. The design, and redesign, of supply chains needs to be continuous based on market data. Invest in networkdesign technologies.
Change internal metrics to a balanced scorecard and force the functions to work better together. Labor turnover, supply reliability, and transportation variation are here to stay. The design, and redesign, of supply chains needs to be continuous based on market data. Invest in networkdesign technologies.
191 qualified global logistics practitioners were surveyed in 2015 by American Shipper magazine for their seventh annual benchmark study of transportation management. However, here is a distillation of the best practices for approaching transportation and logistics IT initiatives provided at the conclusion of the report.
I am speaking this morning at the Terra Technology conference and doing a book signing of my new book, Supply Chain Metrics That Matter. This includes LogicNet Plus, the Inventory and Product Flow Analyst and the Transportation Analyst products, as well as the related technology and support team. It is morning in Orlando.
294 manufacturing facilities produced more than 90 million metric tons of food and beverage in 2021. PepsiCo products then reach shelves through its operating subsidiaries and a complex network of fleet operations. The multinational’s goal is to achieve net zero GHG emissions across their value chain by 2040.
Throughout the supply chain, IoT devices monitor products as they move, tracking critical factors including transportation conditions and environmental parameters. This data feeds directly into the DPP, creating a permanent record of how a product was built.
metric tons of CO2 equivalent per million USD in revenue, down 58% from FY09 levels, despite daily package volumes rising by an average of 121%. FedEx says that since 2005, aviation emissions intensity (the amount of emissions per unit of activity) has dropped 31% and the company is aiming for a 40% reduction by 2034.
Are you using lean in your logistics and transportation management? The transportation company’s culture and behavior should change to apply Lean thinking. Transportation takes time. The list of additional waste generated by transportation goes on and on. 5 Ways to Optimize Your Transportation with Lean.
These Supply Chain Operating Network Strategies enable multi-tier many-to-many enablement of first and second/third tiers of suppliers of services, materials and transportation. Buffer Design. The design of buffer strategies–capacity, inventory, and supplier relationships–to absorb demand and supply variability.
Aligning and integrating key performance metrics across the extended supply chain can be difficult. So, although inventory tends to be a symptom of other supply chain factors; forecast accuracy, customer service objectives, supply chain networkdesign, transportation mode selected, etc. it is often targeted for reduction.
Let’s face it one of the biggest supply chain expenses for any process manufacturer is transportation of ingredients to plants and transportation of finished products to customers. It is not unusual to reduce transportation costs by as much as 30%. It is not unusual to reduce transportation costs by as much as 30%.
A majority of shippers use transportation logistics automation tools like TMS, route optimizers, YMS, WMS, fleet management and freight payment & audit solutions. Focus on traditional metrics. Driving Singular Metrics strategies. Strong planning and networkdesign. Focus on Horizontal Processes.
I find most companies are good at pockets of planning–demand planning, supply planning, transportation planning, material planning or plant scheduling, but the flows are not connected. Few implementations of planning connect to procurement and transportation. Process Integration Across Functions.
Real-World Focus: Designed by industry experts with extensive hands-on experience, ensuring the curriculum is relevant and applicable to real-world challenges. Watch 6 Key Metrics to Include in Your Logistics Dashboard on SCMDOJO YouTube Channel! Moreover, these modules are designed to enhance your logistics pathway.
Many metrics can be used to determine the top 3PL warehousing companies, such as company revenue, the number of warehouses, total warehouse square footage , etc. This compilation is based on the most currently available company revenue data (between 2018 and 2020) without factoring in any other metric. Nippon Express owns more than 31.7
We organize all of the trending information in your field so you don't have to. Join 102,000+ users and stay up to date on the latest articles your peers are reading.
You know about us, now we want to get to know you!
Let's personalize your content
Let's get even more personalized
We recognize your account from another site in our network, please click 'Send Email' below to continue with verifying your account and setting a password.


Let's personalize your content