This site uses cookies to improve your experience. To help us insure we adhere to various privacy regulations, please select your country/region of residence. If you do not select a country, we will assume you are from the United States. Select your Cookie Settings or view our Privacy Policy and Terms of Use.
Cookie Settings
Cookies and similar technologies are used on this website for proper function of the website, for tracking performance analytics and for marketing purposes. We and some of our third-party providers may use cookie data for various purposes. Please review the cookie settings below and choose your preference.
Used for the proper function of the website
Used for monitoring website traffic and interactions
Cookie Settings
Cookies and similar technologies are used on this website for proper function of the website, for tracking performance analytics and for marketing purposes. We and some of our third-party providers may use cookie data for various purposes. Please review the cookie settings below and choose your preference.
Strictly Necessary: Used for the proper function of the website
Performance/Analytics: Used for monitoring website traffic and interactions
Innovations in biodegradable and reusable materials, coupled with lightweight designs that reduce shipping weight, are helping companies minimize waste and lower emissions. Similarly, investing in renewable energy can reduce operating costs while enhancing air quality and benefiting local communities.
System Integration and Data Visibility Orchestration requires connecting warehouse systems, transportation platforms, and ERP data so that status updates, inventory levels, and shipping exceptions are visible without needing to log in to separate systems. This doesnt eliminate those systems, it organizes the data they produce.
The problem was that VMI is a ship through model whereas supply chain planning is a ship from model with different granularity. The biggest issue with CPFR was the quality of the customer forecast. VMI has great promise in the use of channel data and the management of flow. The problems are many.
We’ll examine the key components of efficient supply chains, explore essential performance metrics, and uncover the fundamental drivers that influence efficiency. It’s not about finding the cheapest supplier, but the one that offers the best value considering quality, reliability, and cost.
More and more cargo shifted to ocean transport until the container imbalances resulted in issues with “rolling the freight” from ship to ship despite confirmed bookings. Dwell times grow as more and more ships sit in the ocean waiting to unload. Watermelon Metrics Don’t Drive The Right Results.
As consumer spending fell, the days of escalating ocean freight and extreme shipping variability eased this year. For organizations layered in functional metrics and driving a cost agenda, this is a tough nut to crack. A planning master data layer measures and tracks shifts in lead times, conversion rates, and quality.
3 Key Metrics for Measuring Supply Chain Performance Beyond Cost Reduction. 10 Soft Metric Considerations in Measuring Supply Chain Performance. Twitter Google+ LinkedIn The post 3 Core Metrics & 10 Soft Metrics for Measuring Supply Chain Performance appeared first on Transportation Management Company | Cerasis.
Inventory accuracy and minimizing stockouts are very important to customer satisfaction, but a few other metrics also impact the ability to meet customer expectations. This measures the number of orders or order lines shipped on time and without backorders or shortages. Choosing Metrics. Service Request Resolution Time.
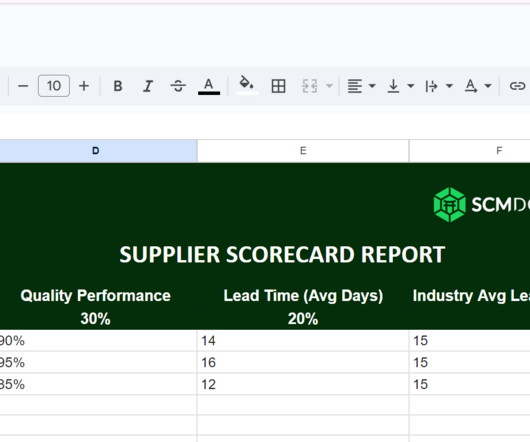
Supply chain reports are data-driven documents that provide key metrics and insights into various aspects of your supply chain, including: Inventory Levels Tracking stock levels in real-time to ensure adequate inventory to meet demand while minimizing holding costs. What are Supply Chain Reports? defects, damage, non-conformance).
According to McKinsey survey of global supply chain leaders , only 53% of respondents describe the quality of data in their supply chain planning systems as “sufficient” or “high.” ” Yet leaders with high-quality master data are 1.5x less likely to be affected by supply chain disruptions.
He had a load full of cotton bales, and while idling away hours at a shipyard watching stevedores load other cargo onto ships he dreamed up containers that transformed global supply chains. Containerization eventually reduced shipping and loading costs by at least 75%.
I was at a customer last week that shipped to distributors and did not know the site of customer facilities. The focus is on functional metrics, but are unable to get to overall supply chain metrics. Quality data. This is a control center to mine consumer review data to control supplier part quality. Master data.
We conclude our series on supplier quality management (SQM) today with a look at some case studies and examples of benefits derived from the application of a supplier quality management system. Examples and Case Studies from the Implementation of a Supplier Quality Management System.
While many businesses are interested in procuring the best quality goods and services at the cheapest price, cost is not the only procurement factor. That’s where Procurement Metrics and Key Performance Indicators (KPIs) come into play. In this post, we’ll unpack ten top procurement metrics and why they matter.
RELATED CONTENT RELATED VIDEOS Last Mile Delivery Logistics HR & Labor Management Related Articles Airbus Reaches Deal With Canada Workers, Averting Lockout Threat Postal Workers Strike in Canada, Disrupting Holiday Shipments DHL Express Canada Offers Flat-Fee International Shipping SupplyChainBrain J.B.
Your business is booming, orders are flying in, and you’re drowning in a sea of shipping labels and tracking numbers. Enter shipment management software—a lifesaver for businesses looking to streamline their shipping processes and maintain their sanity. Cost Savings : Find the best shipping rates and avoid costly mistakes.
You’re expected to ship more orders, faster, with fewer errors — all while managing rising costs and shrinking labor pools. Understanding key warehouse productivity metrics is essential for evaluating the success of system integration. Warehouse operators are under constant pressure to do more with less.
The company said that it used 85,916 metric tons of single-use plastic that year, an 11.6 Walmart and Agritask said they selected cherries and blackberries for the pilot because those fruits are highly sensitive to temperature fluctuations and moisture levels, which can impact their growth and quality. percent decrease from 2021.
This extensive connectivity has resulted in impressive metrics: 1.2 A key differentiator is Movement’s approach to data quality. Last Mile Insights helps customer service teams surface network-wide issues in real-time and provide “Intelligent predictive exceptions based on over 19B shipping events.”
In dynamic slotting, goods for which there is high demand are located nearer to the shipping docks to minimize travel. It is better to receive inventory on a loading dock, take the inventory needed for a hot shot shipment, and move that inventory through the DC to a shipping dock where it is loaded on a truck. It doesn’t.
Again, we’re focused on those directly involved in product production, such as employees who work on the assembly line, quality inspectors and the managers who oversee them. Quality inspections of products. Maybe you could reduce shipping costs by making more bulk purchases or buying more locally. Equipment depreciation.
Start by mapping the flow of materials from the moment they arrive at the receiving dock until they depart the shipping area. Common layout patterns include: U shaped : Reduces travel distances by looping between receiving, storage, and shipping. Tie organization metrics like error rates and accuracy into performance reviews.
Fortunately, applying metrics to multi-source operational information that’s stored and managed in a data hubs greatly minimizes these issues. Supply chain metrics provide the intelligence needed to make better projections and more informed choices in such a market. Our Top 24 Supply Chain KPIs & Metrics. Perfect Order Rate.
And let’s say that we have seven line items in stock and can ship them complete. To fill the 8th line item complete we had to ship the product from a DC across the country. For the 9th line item we ran an overtime production shift to get the order shipped complete on time.
One of my favorite interviews on this topic, that I recently completed for my upcoming book Metrics That Matter , was with Amway’s Chief Supply Chain Officer George Calvert. The path I took came through R&D where I had many different roles including R&D management and quality assurance. Free Trade agreements also matter.
Financial Reengineering is the radical redesign of business processes and organizational structure in order to achieve significant improvements in performance, such as productivity, cost reduction, cycle time, and quality. Snow fell last night as I worked on my last Supply Chain Metrics That Matter report. Sounds good? Think again.
He sees a near future in which there are multiple agents, each with their own realm of responsibility, such as shipping, pricing and forecasting. Koganti said this is the fastest-growing use of AI in supply chain, especially when it comes to forecasting, procurement and fulfillment.
According to Mitchell’s NY , last mile logistics is seen as the least efficient leg of shipping, and it accounts for up to 20 percent of the total shipping cost of a product. Performance measurement goes back to cutting costs wherever possible, without sacrificing quality or service. Be Consumer-Centric. Measure Performance.
Barcode and RFID scanning drastically reduce errors and accelerate processes like receiving, picking, and shipping. Instant Updates: Know immediately when items are received, shipped, or moved within the warehouse, with ERP data ensuring synchronization and accuracy.
Without baseline metrics on what you want to improve on and why, how can you be confident your strategy is working? And because machine learning systems get smarter over time, having a consistent method of measurement is even more important to ensure you can accurately track how outcomes and ROI are improving against established metrics.
Failed SCM implementation causes shipping errors. WMS failure causes Adidas to under ship by 20%. Every company today runs on data – the key to using your data is choosing the right metrics for visibility into your supply chain. Fill rates, Perfect Order, Delivery Quality, Inventory turns, Order Status. Bankruptcy.
Metrics such as lead-times, forecast accuracy, inventory levels, and service are used to measure operational risks. Balancing supply and demand by orchestrating the flow of materials and information is a key requirement for managing operational risks.
Customers now expect free, fast shipping from retailers, and regardless of where your distribution center is located, your customers want what they order as soon as possible. As a result, the warehouse can reduce the amount of inventory necessary if similar inventory control can be achieved closer to consumers.
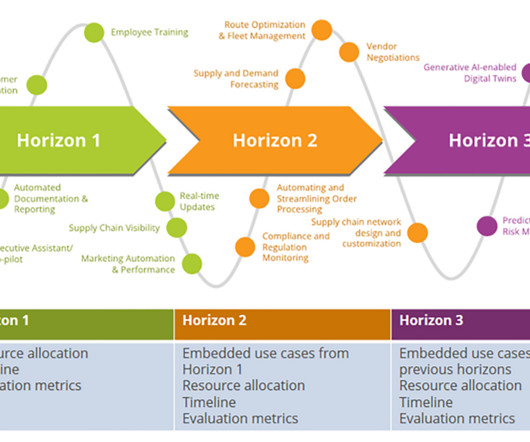
Generative AI and LLMs have potential benefits but face challenges such as data quality across large data sets and ethical implications with bias, fairness, and transparency. To ensure successful integration, they should create a plan with timelines, resources, and evaluation metrics (refer Figure 2).
. “Each supply chain manager needs to supervise the taking in of raw materials, making and testing of the product or service and shipping it. To ensure that you always deliver quality to your customers, you need to include quality testing at this stage. If you don’t, the quality of your end product won’t be as consistent.”
We have found that supply chain metrics are gnarly and complicated.During In our program, cost avoidance, while desirable, does not count towards the metric. This also improved the consistency of our product quality, reduced costs and inventory, and enabled improved reliability through the resulting simplified process.
As of January 1, 2022, it was taking a company an average of 73 days to deliver goods to truck or rail carriers after booking with an ocean carrier and completing the cross-ocean journey, according to E2open’s Ocean Shipping Index. Greener Shopping and Shipping: The Rise of Carbon Neutral e-Commerce Delivery. MORE FROM THIS EDITION.
Whether you’re sourcing from different warehouses or shipping to various branches, VRM tools help track and manage vendors across multiple locations. Kechie ERP with VRM capability helps you monitor metrics like delivery times, product quality, and order consistency.
SupplyChainBrain Container Ship Explodes, Catches Fire Off Coast of India More from this author Subscribe to our Daily Newsletter! Supply Chain Finance & Revenue Management Lawyer for 737 Crash Victim Families Slams DOJ Deal with Boeing Quality & Metrics DHL Express Canada Workers on Strike Following Lockout Last Mile Delivery U.S.
Supply Chain Finance & Revenue Management Supply Chain Visibility Quality & Metrics Sourcing/Procurement/SRM Supply Chain Security & Risk Mgmt RELATED CONTENT RELATED VIDEOS Subscribe to our Daily Newsletter! To keep them moving, we can’t afford to ignore what the data is telling us.
Webinars Five Ways AI-Enabled Digital Twins Will Shape the Future of Supply Chains Technology Ships’ Electronics Increasingly Jammed Since Israel Struck Iran Global Gateways Watch: The Crisis in Access to Critical Raw Materials Supply Chain Visibility Digital Edition SupplyChainBrain 2025 ESG Guide: Is ESG Still Relevant?
Supply Chain Finance & Revenue Management Lawyer for 737 Crash Victim Families Slams DOJ Deal with Boeing Quality & Metrics U.S. Trade Deficit Narrows by Most on Record as Imports Plunge Global Trade & Economics Ship Traffic Through Red Sea Remains Sparse, Despite Houthi-U.S.
Supply chain organizations within the automotive supplier industry contribute to manufacturing excellence in many ways, including quality, cost, and delivery to their OEM and subsystem customer base. Ship according to a latest set of transportation routing instructions. Real time response to alerts, issues, and exceptions.
Operational risks: Supplier bankruptcies, poor quality control, or delays in logistics. Whether its political unrest in a region, shipping delays, or a sudden price hike, relying too heavily on one source can bring your operations to a grinding halt. Reputational damage: Negative press or social media backlash from unethical suppliers.
We organize all of the trending information in your field so you don't have to. Join 102,000+ users and stay up to date on the latest articles your peers are reading.
You know about us, now we want to get to know you!
Let's personalize your content
Let's get even more personalized
We recognize your account from another site in our network, please click 'Send Email' below to continue with verifying your account and setting a password.


Let's personalize your content